The USDCAD price breaks the support level of negative technical pattern- Analysis-23-02-2026
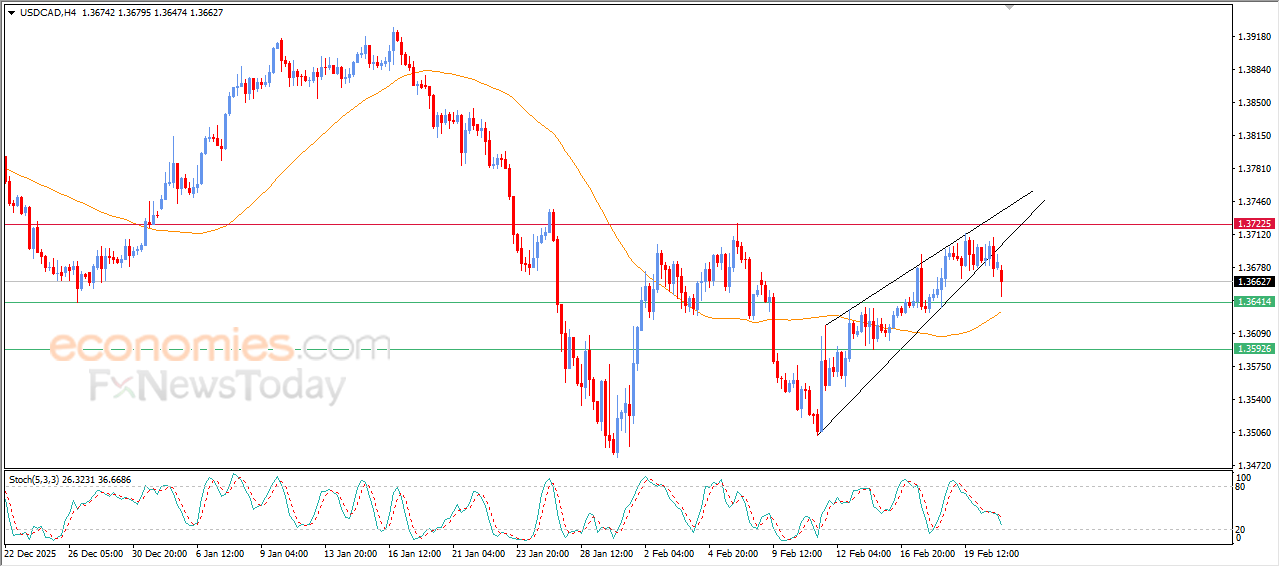
The (USDCAD) price declined in its last intraday trading, amid the emergence of negative signals from relative strength indicators, after reaching overbought levels, to break the support level of short-term negative technical formation, which is represented by the rising wedge pattern, on the other hand, the dynamic support that is represented by the trading above EMA50 represents a key support against extending the losses in the upcoming period.
The USDJPY declines after reaching our expected target-Analysis-23-02-2026
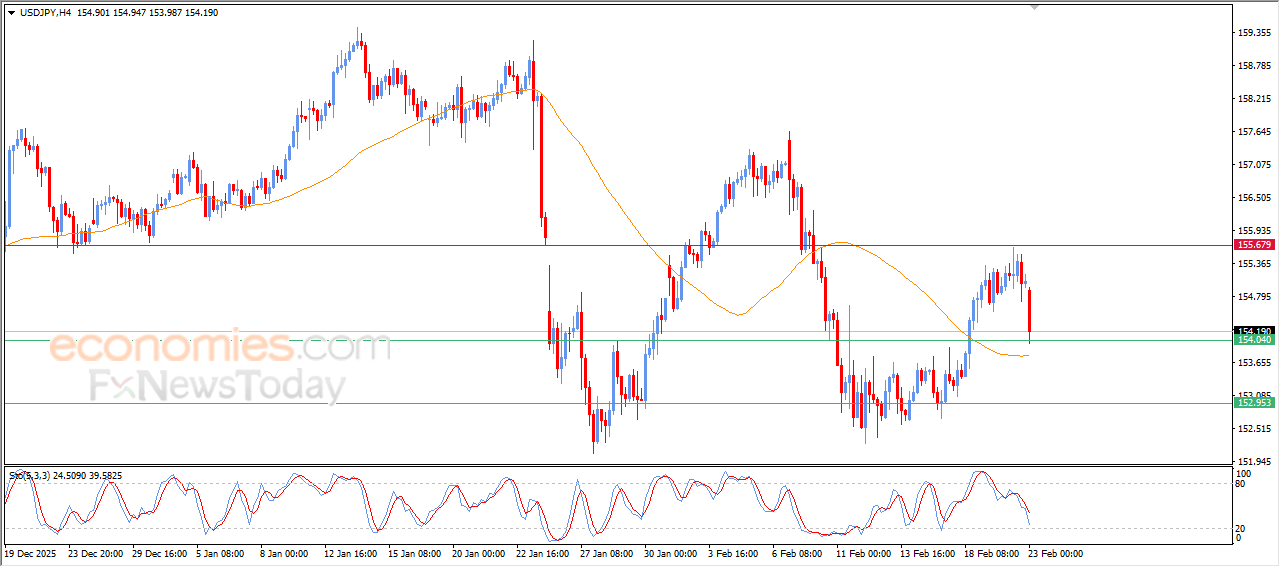
The (USDJPY) witnessed sharp losses in its last intraday trading, after reaching our expected target in our previous analysis at 155.65 resistance, to decline with the emergence of negative signals from relative strength indicators, after reaching overbought levels, leaning on the key support at 154.00, which is considered as key support that will detect the upcoming trend on the intraday basis.
GBPUSD price rises amid the negative pressures - Analysis- 23-02-2026
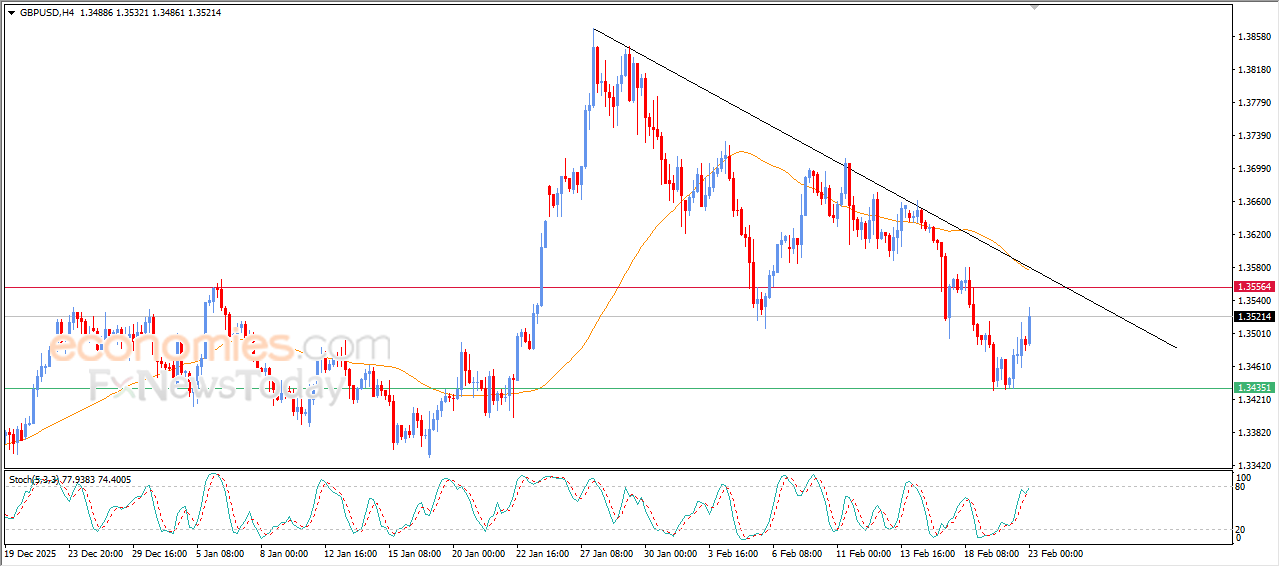
GBPUSD rose in its last intraday trading, amid the dominance of the main bearish trend on short-term basis, with its trading alongside supportive trend line for this path, besides the continuation of the negative pressure due to its trading below EMA50, reducing the chances of full recovery on near-term basis, especially with the relative strength indicators, exaggeratedly compared to the price move, indicating a beginning of negative divergence.
Bitcoin (BTCUSD) reaches our expected target - Analysis-23-02-2026
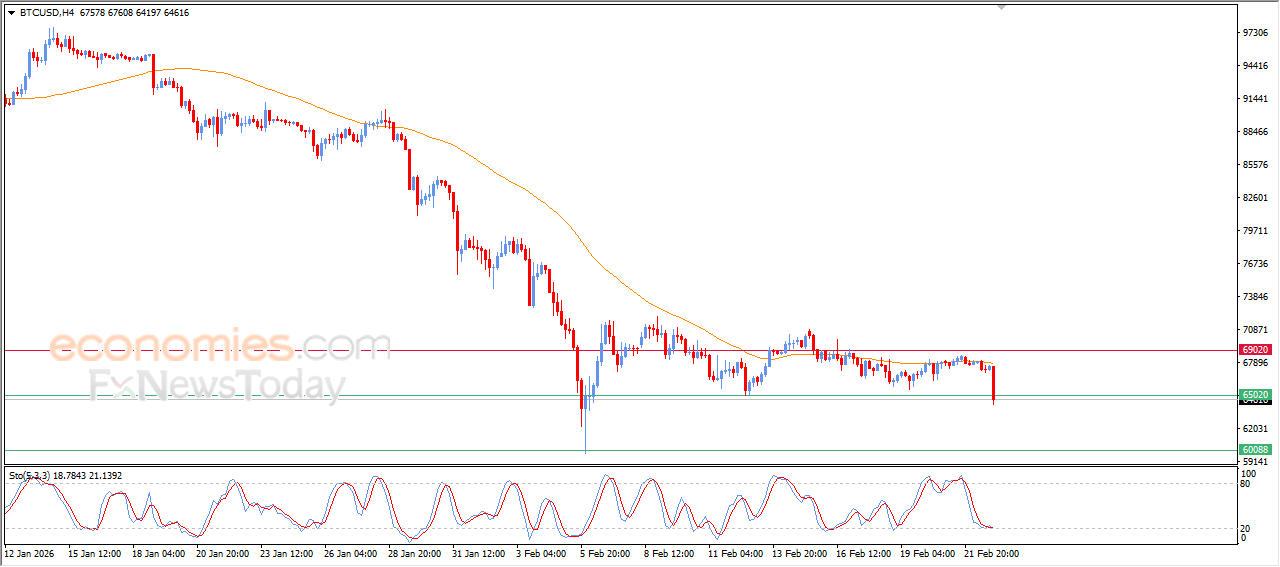
Bitcoin’s price (BTCUSD) slipped lower in its recent intraday trading, and it remains under the dominance of clear selling pressures, amid its stability below EMA50, indicating the continuation of the negativity on its moves, under the dominance of the main bearish trend on short-term basis, reaching previously expected target in our previous analysis at $65,000 support.
This movement is accompanied by the emergence of negative signals from relative strength indicators, despite reaching sharp oversold levels, indicating the weakness of the overbought momentum.