EURUSD Pauses Before Resuming Its Bullish trend – Analysis – 02-07-2026
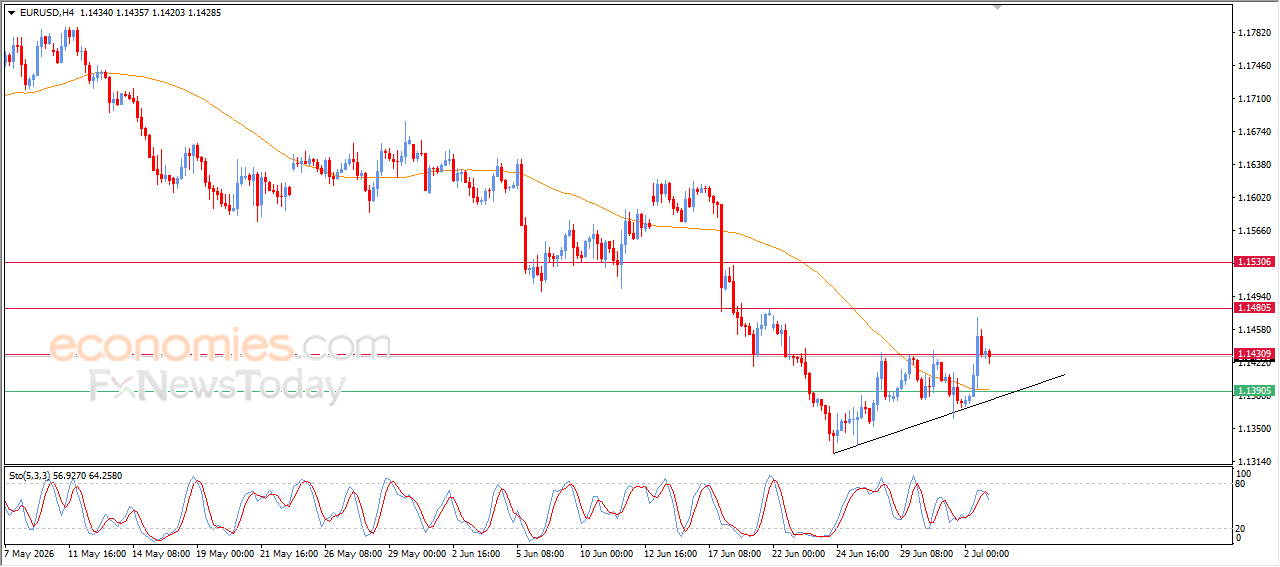
The EURUSD pair declined during its latest intraday trading in a natural profit-taking move following recent gains, while attempting to build fresh bullish momentum.
The decline coincided with efforts to ease overbought conditions on the relative strength indicators, as negative signals started to emerge. This may help the pair regain momentum. However, the technical outlook remains positive, with the short-term corrective bullish trend still in control. Price continues to trade along a supportive trendline and above EMA50, reinforcing the chances of further gains in the near term.
Evening update for Bitcoin -02-07-2026
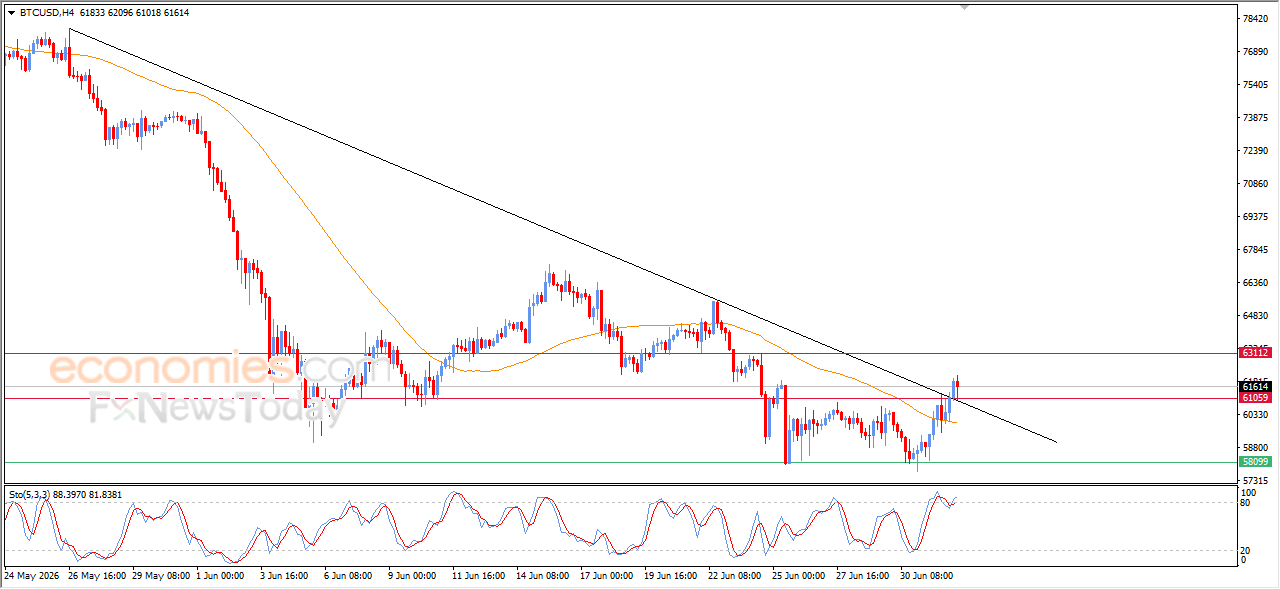
Bitcoin (BTCUSD) settles with series consecutive losses in its last intraday trading, supported by its continued trading above EMA50, which provided supportive base for moving higher to breach a main bearish trend line on the short-term basis, which represents a strong signals for extending the corrective gains in the upcoming near period, especially with the emergence of the positive signals from the relative strength indicators after offloading its overbought conditions.
Evening update for crude oil -02-07-2026
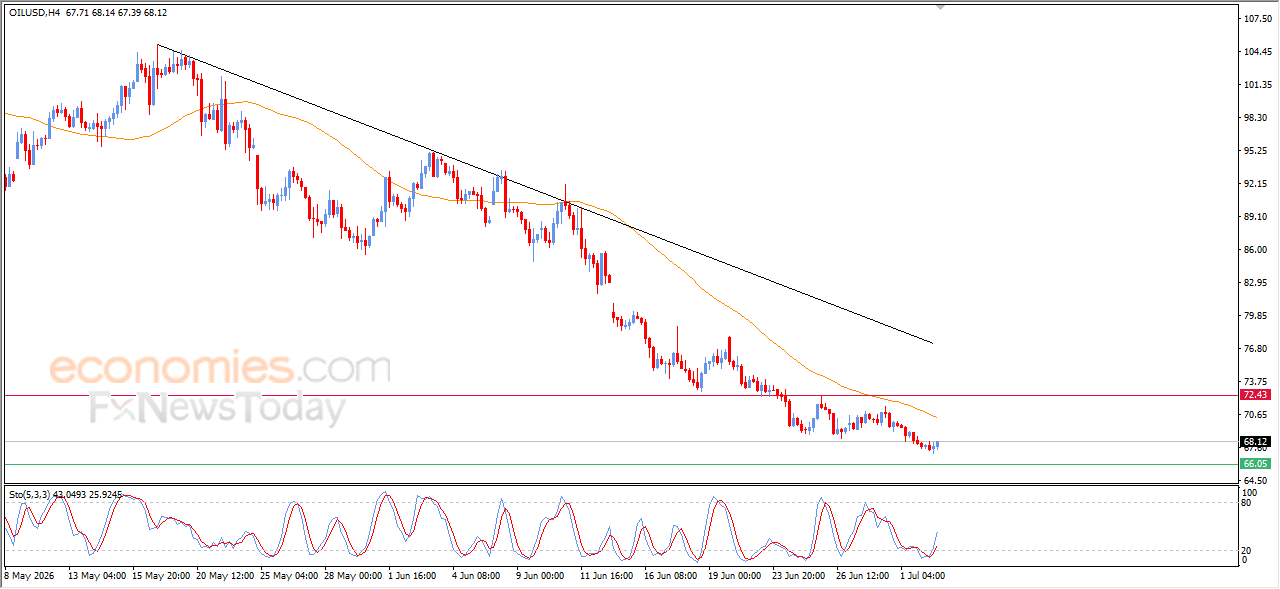
Crude Oil prices rose in their latest intraday trading, attempting to recover some of its previous losses and offloading its oversold conditions on the relative strength indicators, especially with the emergence of the positive signals from them, this comes amid the dominance of the main bearish trend on the short-term basis, with the continuation of the negative pressure that comes from its trading below EMA50, reducing the chances of sustainable recovery in the near upcoming period.
Evening update for gold-02-07-2026
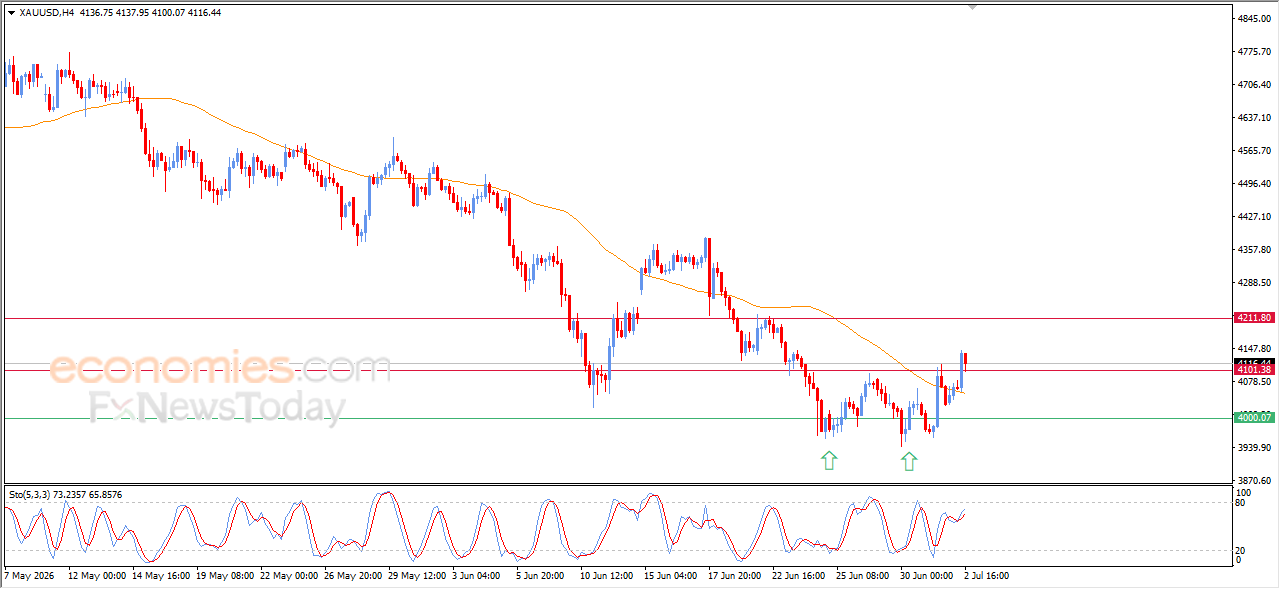
Gold rose in its recent intraday trading, breaching the key resistance level at $4,100, this resistance represents a neckline for positive technical formation on the short-term basis (the double bottom pattern), as a clear signals for resuming the corrective trend in the near upcoming period, especially with the dynamic support that is represented by its trading above EMA50, which prevented its decline in the last period, besides the emergence of the positive signals from the relative strength indicators.