Gold price decline is affected by significant resistance -Analysis-22-07-2025
AI Summary
- Gold price declined due to significant resistance at $3,400
- Price gathering gains after strong bullish wave, potential for new bullish momentum
- Clear overbought condition on RSI, main trend remains bullish on short-term basis
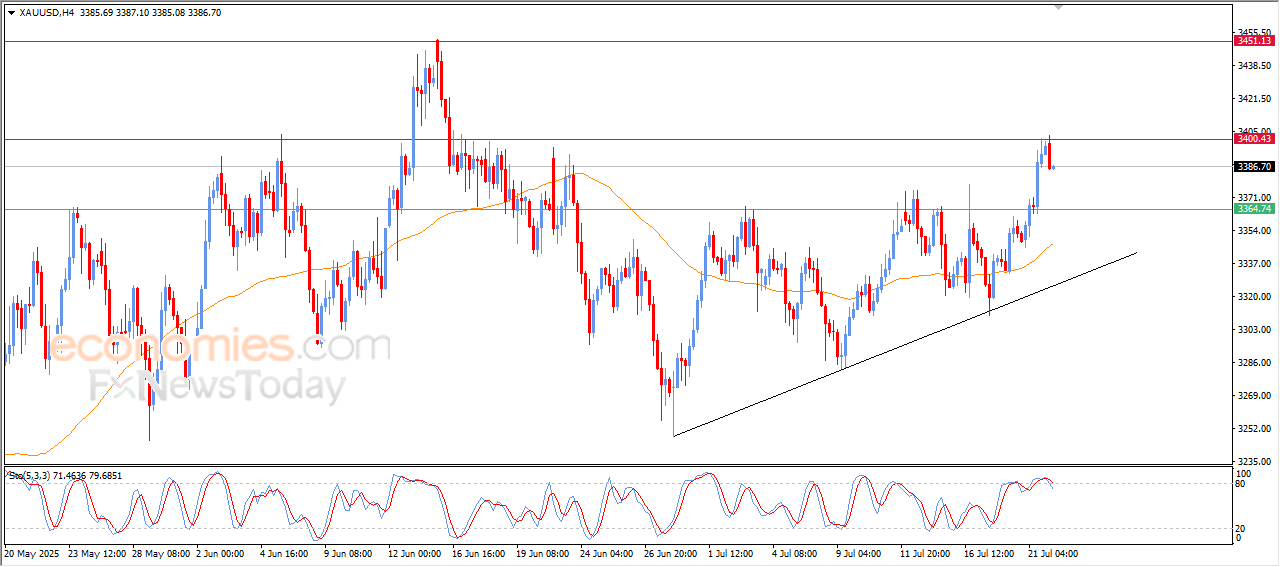
The (Gold) price declined in its last intraday trading, affected by the stability of the main resistance at $3,400, which represents our last target, the price is gathering gains after a strong bullish wave, which provides a chance for catching its breath and gaining a new bullish momentum that may assist it to attempt to breach this resistance.
At the same time, the price is attempting to offload the clear overbought condition that appears on the (RSI), Especially with the emergence of negative signals, which opens the way for a rise, and the main trend remains bullish on the short-term basis, with the continuation of its trading alongside a minor bias line that supports this track.
High-Accuracy Trading Signals – Provided by BestTradingSignal.com
Subscribe now to professional, carefully structured packages covering major global markets. Receive signals directly via Telegram from our expert team.
- US Stock Signals starting from €44/month – Subscribe here
- Crypto Signals starting from €49/month – Subscribe here
- Forex Signals starting from €49/month – Subscribe here
- VIP Signals (Gold, Oil, Forex, Bitcoin, Ethereum, Indices) starting from €179/month – Subscribe here
The longer your subscription, the bigger the discount and the better the rate.
See the full results here: Trading Signal Results by BestTradingSignal.com; Week of July 14–18, 2025
EURUSD is in a truce to catch breath-Analysis-22-07-2025
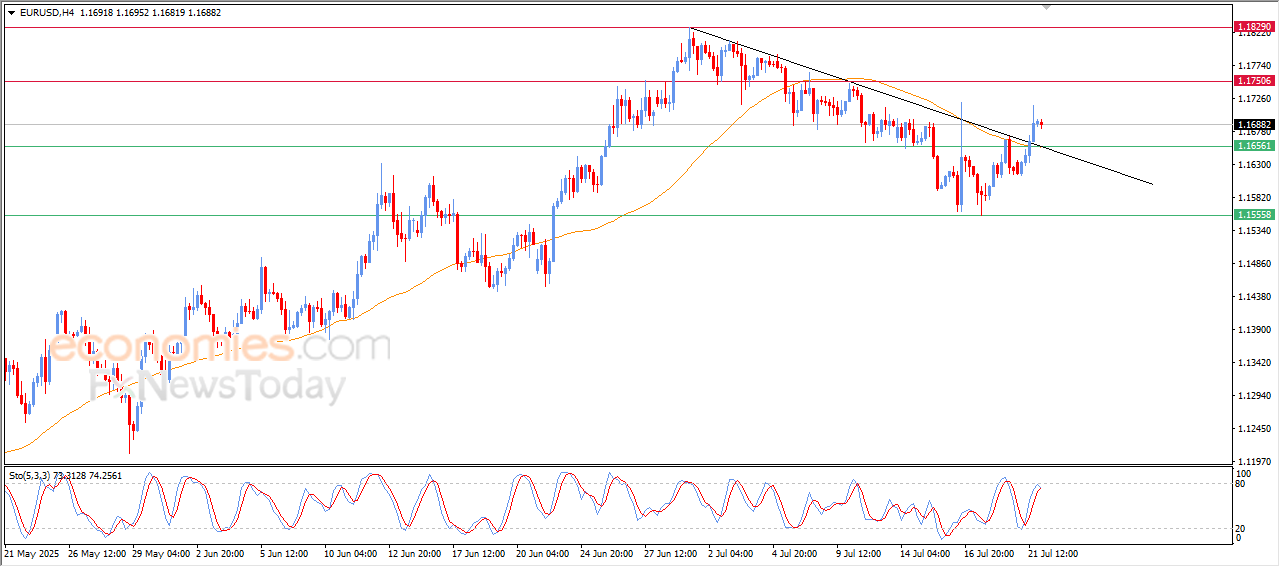
The (EURUSD) settled high in its last intraday trading, after breaching bearish correctional trend line on the short-term basis, which represents an early technical sign for a potential turn in the track, accompanied by releasing the negative pressure of the price due to its previous trading below EMA50, which opened the way for catching breath after a strong bullish wave.
This relative stability might provide a preparatory foundation for a new rise, especially with the continuation of the positive signals from the (RSI), if the price manages to keep this positive performance, if the price witnesses a new rise to higher resistance levels in a potential bullish wave frame.
Evening update for Bitcoin (BTCUSD) -21-07-2025
The (BTCUSD) declined in its last intraday trading, after its failure in surpassing the negative pressure of the EMA50, attempting to gain a bullish momentum that might assist it to recover and rise again, amid the dominance of the main bullish trend on the short-term basis and its trading alongside a supportive bias line for this trend.
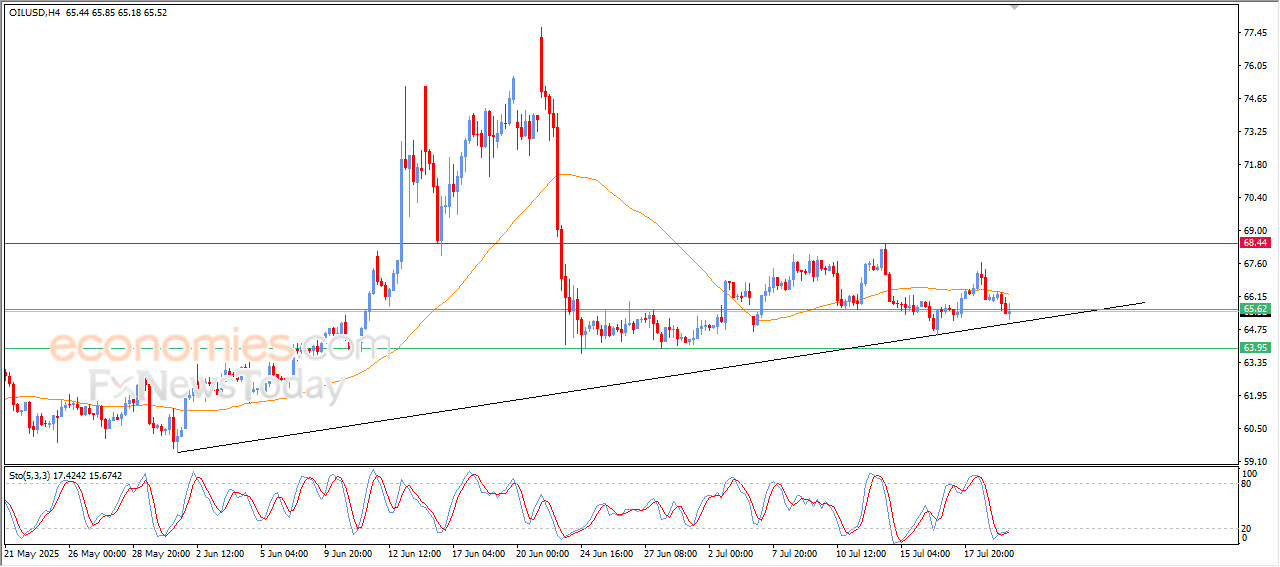
Evening update for crude oil -21-07-2025

The (crude oil) witnessed fluctuated trading in its last intraday levels, amid the continuation of the negative pressure that comes from its trading below EMA50, with its trading alongside a main bullish trend line on the short-term basis, with the beginning of forming positive divergence on the (RSI), after reaching oversold levels, exaggeratedly compared to the price move, with the beginning of the positive signals from there.