Gold prices stabilize in a negative zone - Analysis-29-04-2026
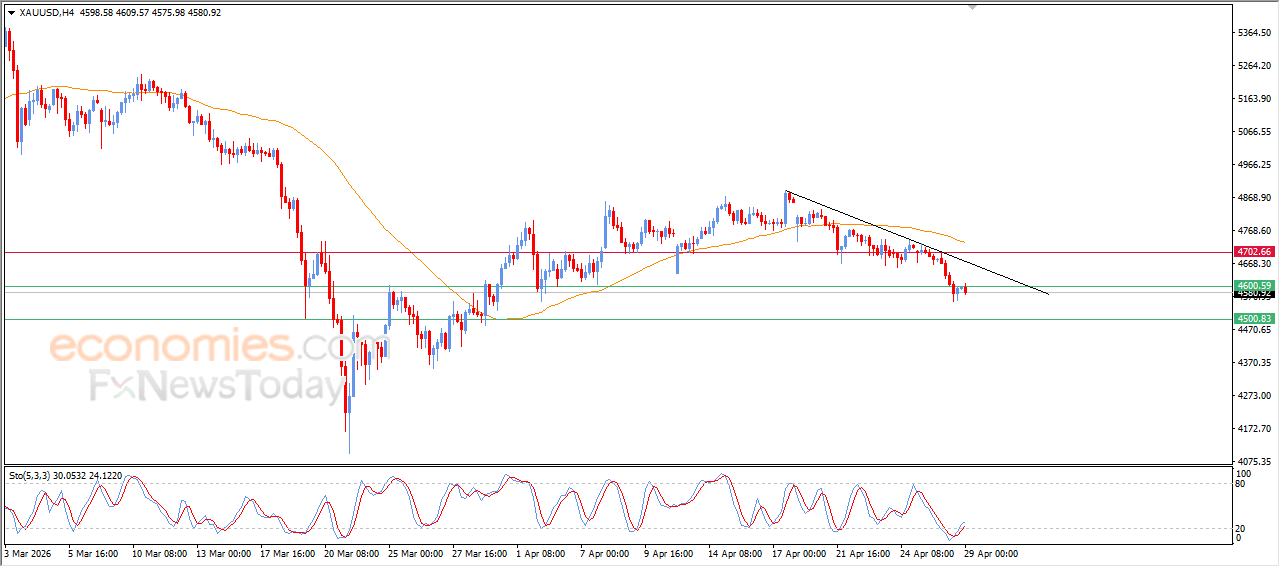
Gold declined in its recent intraday trading, settling below the $4,600 support level, providing clear technical confirmation of a breakdown and its shift into resistance. This reflects the strength of the short-term bearish trend and the continued dominance of selling pressure.
Despite some positive signals appearing on the relative strength indicators after reaching oversold levels, their impact remained limited and failed to support the price. This reinforces the current negative outlook, which is intensified by the price continuing to trade below its EMA50, increasing the likelihood of further decline in the near term.
EURUSD price shows limited recovery within a bearish trend - Analysis-29-04-2026
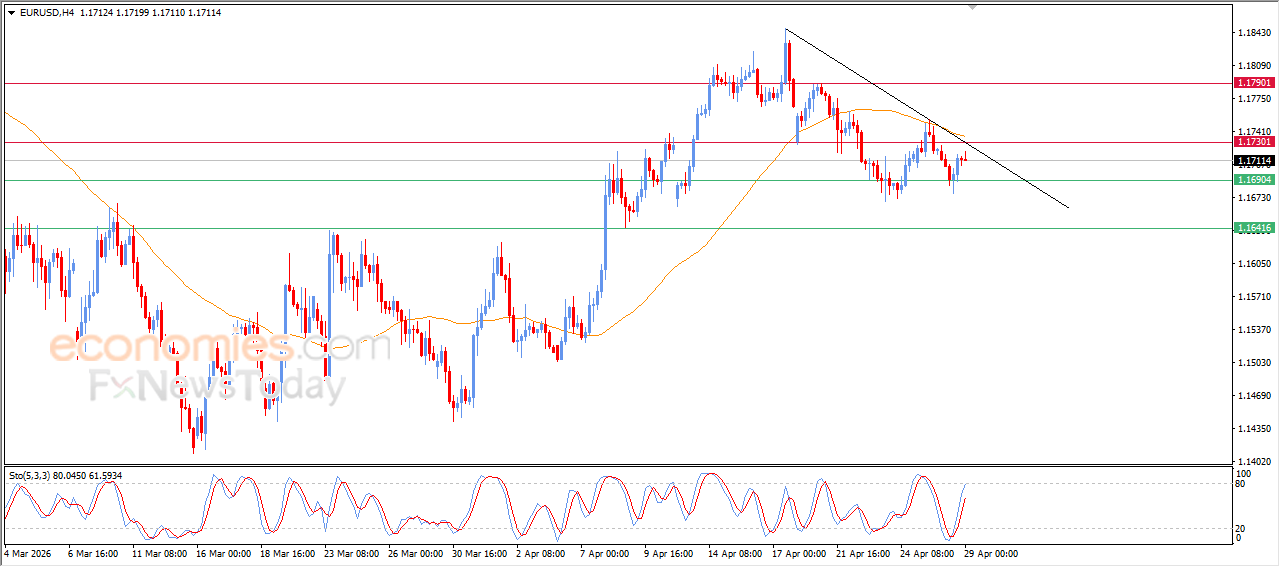
The EURUSD pair is holding onto gains in its recent intraday trading, after rebounding from the 1.1690 support level, which previously acted as a price target, providing positive momentum that helped it recover part of its recent losses and achieve this relative improvement.
This performance comes with offloading oversold conditions on the relative strength indicators. However, negative pressure remains in place, as a short-term bearish corrective wave continues to dominate, with trading along a downward-sloping trend line supporting this path. Additionally, the pair is still trading below EMA50, which may limit the chances of extending the recovery in the near term.
Evening update for Bitcoin -28-04-2026
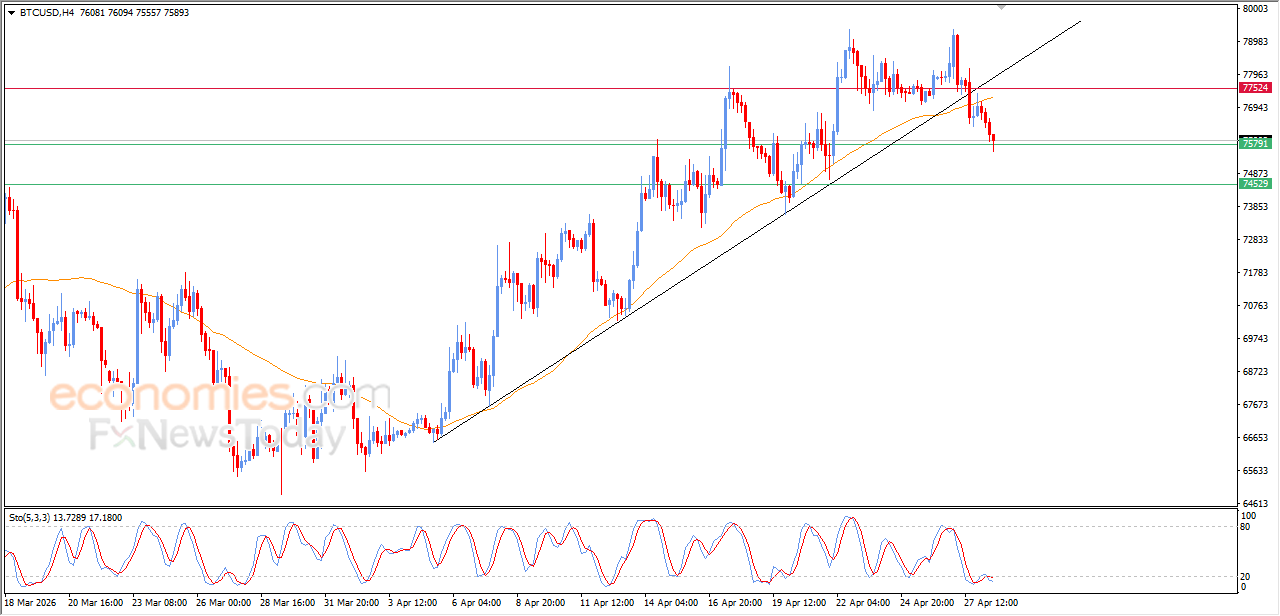
Bitcoin (BTCUSD) kept declining in its last intraday trading, to reach $75,500 support level, which was a target in our previous analysis, affected by breaking main bullish trend line on the short-term basis, with the continuation of the negative pressure due to its trading below EMA50, besides the emergence of negative overlapping signals on the relative strength indicators, after offloading some of its oversold conditions.
Evening update for crude oil -28-04-2026
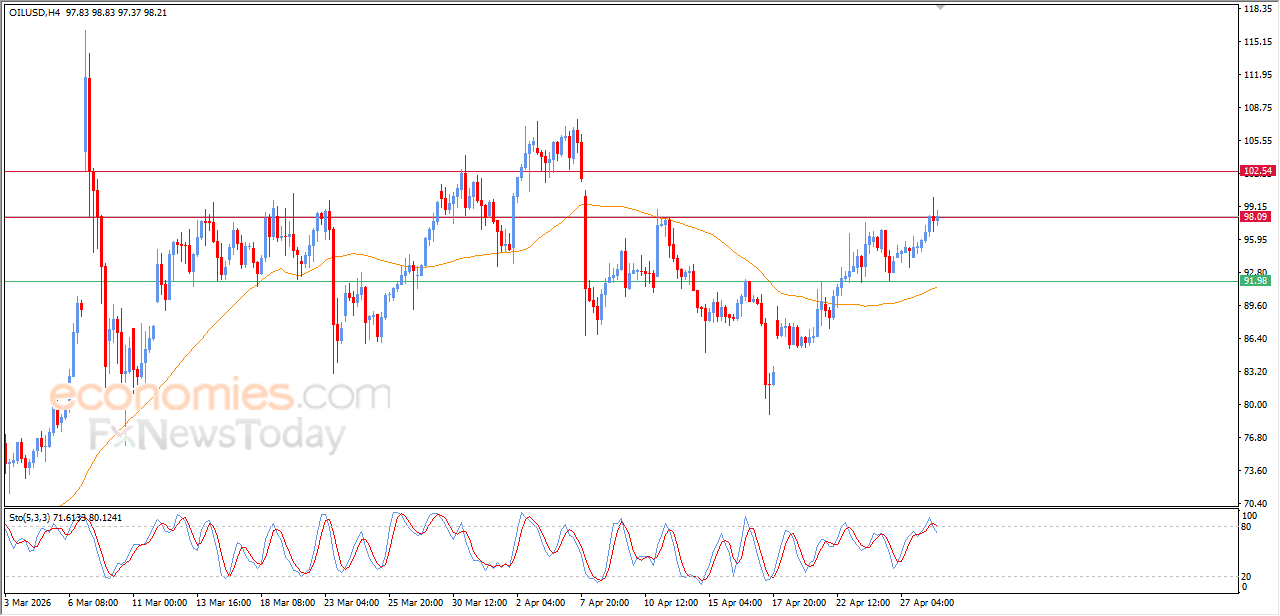
Crude oil prices witnessed fluctuated trading on its recent intraday levels, due to the stability of the key resistance at $98.00, to attempt to gain bullish momentum that may help it to breach this resistance in the upcoming near period, attempting to offload some of its clear overbought conditions on the relative strength indicators, with the emergence of the negative signals from there, amid the continuation of the dynamic pressure that is represented by its trading above EMA50, keeping the positive pressure and reinforces the chances of its recovery.