Forecast update for crude oil -12-01-2026
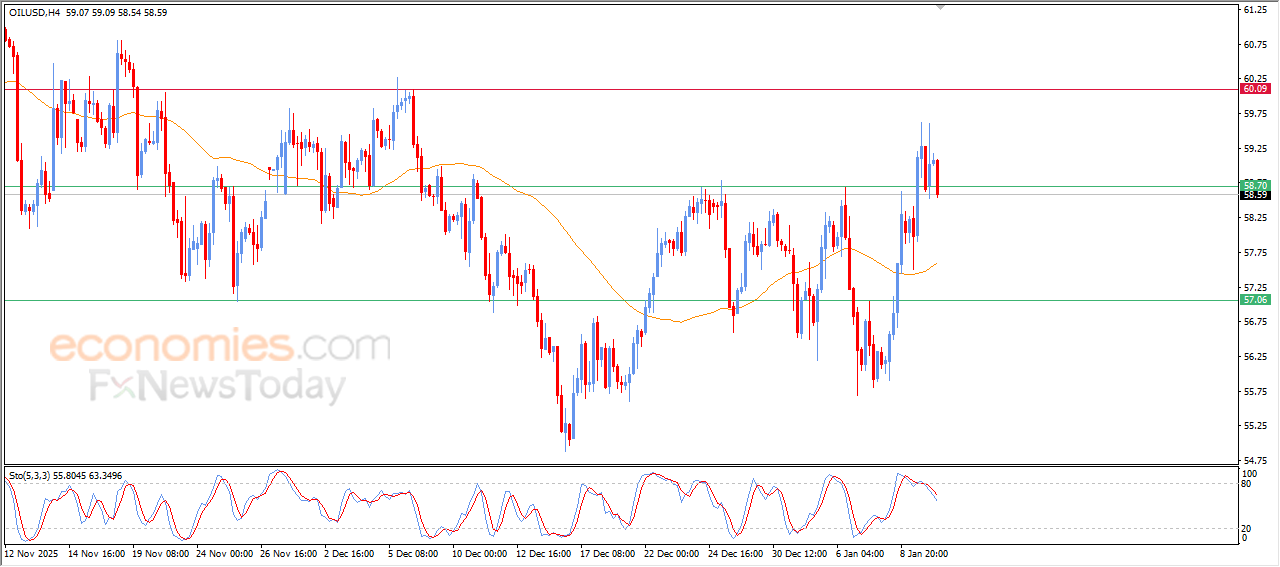
The price of (crude oil) declined in its last intraday trading, affected by the emergence of the negative signals from the relative strength indicators, after reaching overbought levels, to attempt to offload these overbought conditions, attempting to gain new bullish momentum that might support its recovery and resuming the rise in the upcoming period.
Despite this intraday decline, the bullish support remains valid by the trading above EMA50, to indicate the continuation of bullish corrective wave on the short-term basis, limiting the current negative pressures.
Forecast update for silver -12-01-2026
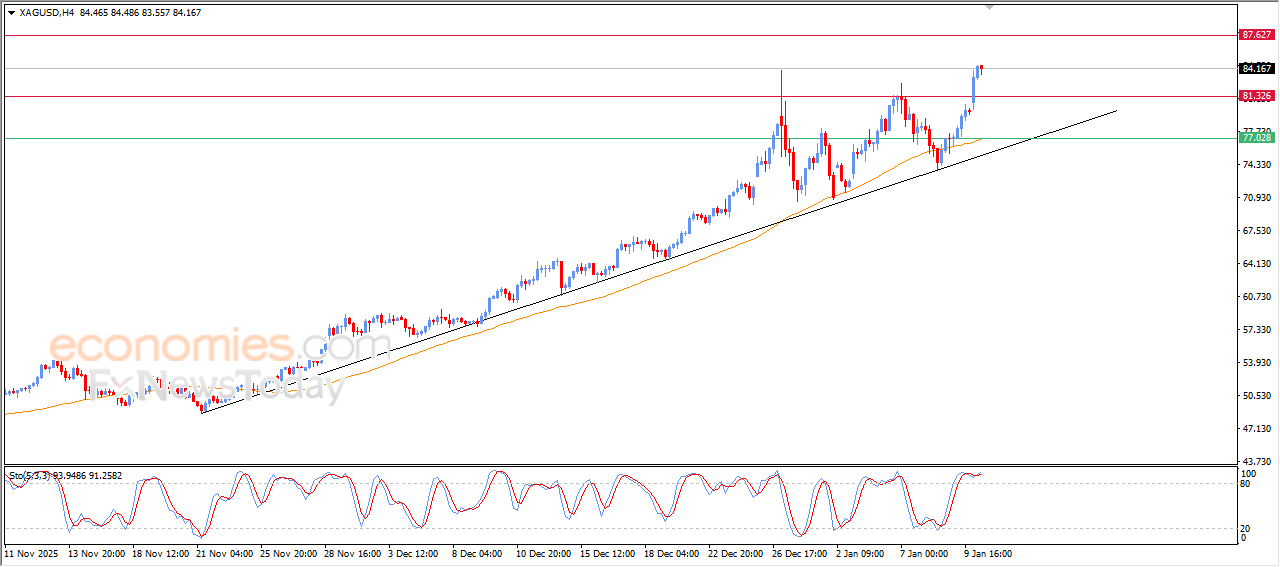
The price of (silver) settles with sharp gains in its last intraday trading, recording new all-time highs, supported by its continuous trading above EMA50, reinforcing the stability and dominance of the main bullish trend on the short-term basis, especially with its trading alongside trend line, besides the emergence of the positive signals from the relative strength indicators, despite its stability in overbought levels.
Forecast update for Gold -12-01-2026.
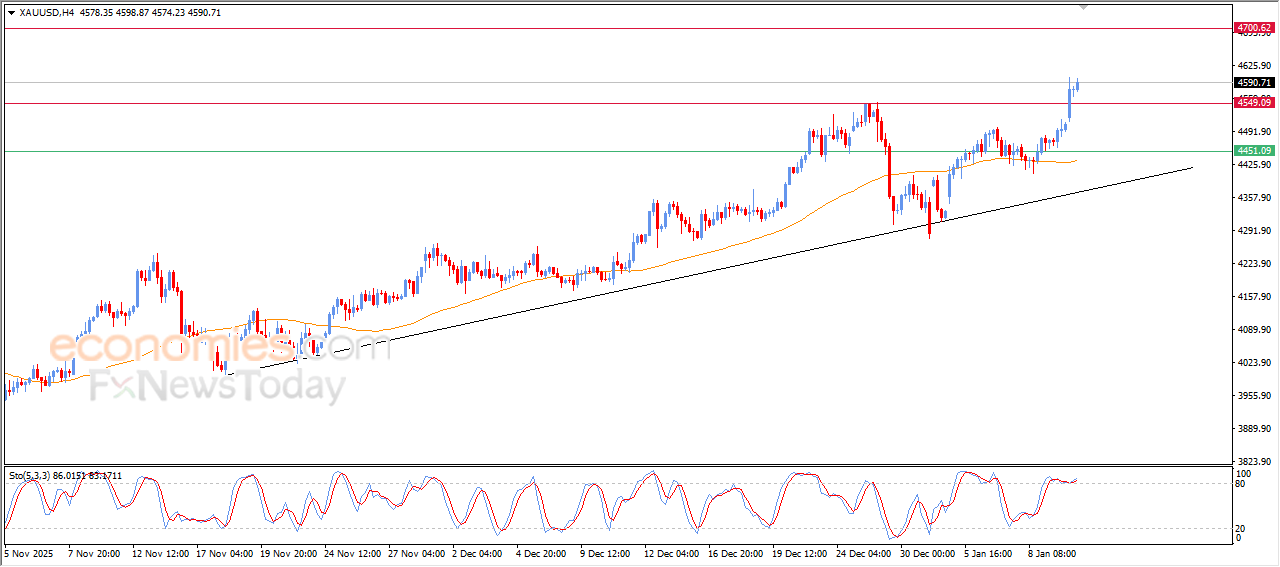
The price of gold (GOLD) kept rising in its last intraday trading, after recording its early trading for today to confirm breaching the key resistance level at $4,550, supported by the dominance of the main bullish trend on the short-term basis, with its trading alongside supportive trend line, besides the continuation of the dynamic support that is represented by its trading above EMA50, noticing the emergence of the positive signals from the relative strength indicators, despite its stability in overbought levels.
Forecast update for EURUSD -12-01-2026.
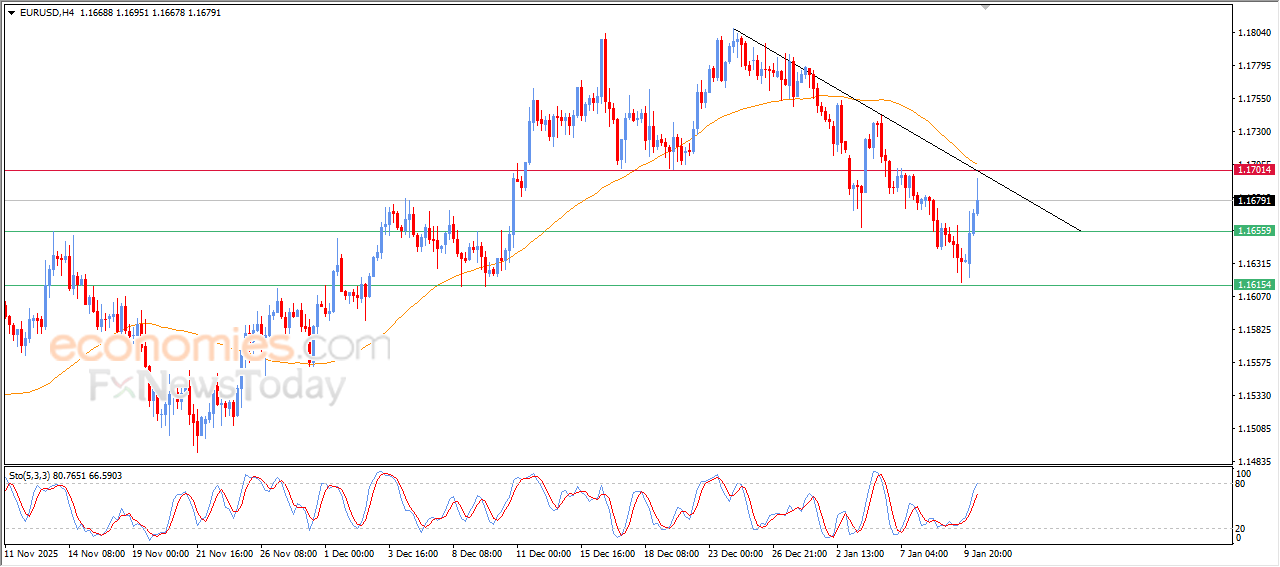
The price of (EURUSD) extended its cautious gains in its last intraday trading, taking advantage of the positive signals emergence from the relative strength indicators, and we notice that these indicators have reached exaggerated overbought levels, indicating a quick decline for the bullish momentum, amid the continuation of the negative pressure due to its trading below EMA50, and under the dominance pf bearish corrective wave on the short-term basis that is reinforced by supportive trend line.