Silver price is under negative pressure- Analysis- 13-04-2026
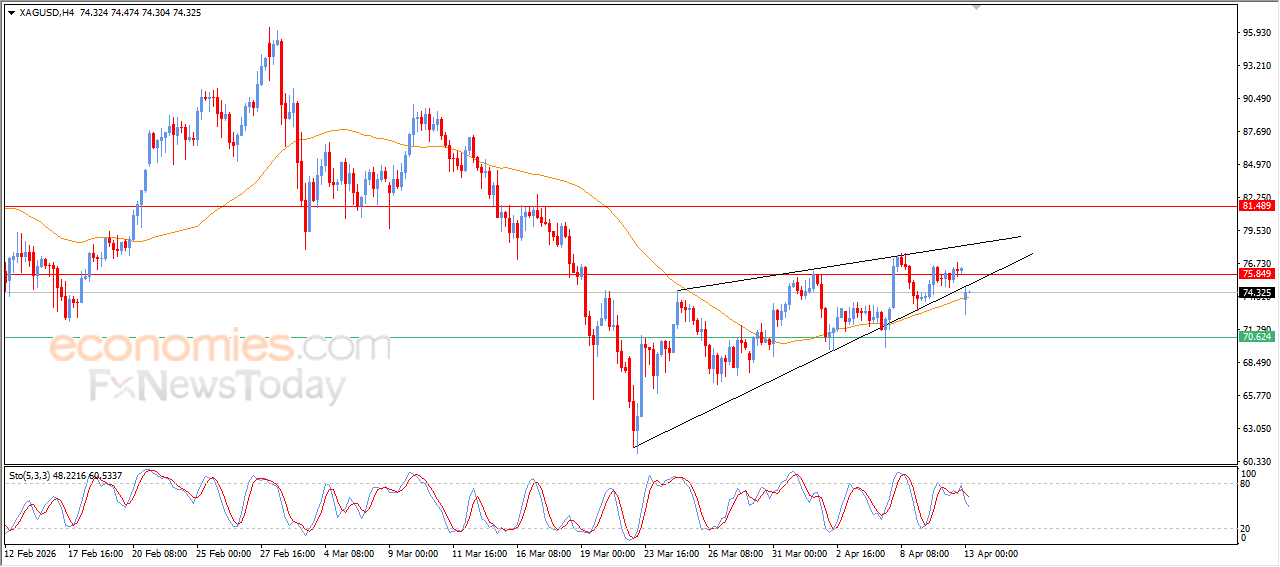
Silver price slipped lower during its recent intraday trading, affected by the stability of the key resistance at $75.85, pushing the price to decline and break bearish technical formation on a short-term basis that is represented by the rising wedge pattern, as a signal that indicates increasing the selling pressures on its current movements.
This decline accompanied by the negative signals emergence from the relative strength indicators after reaching overbought levels, which reinforces the likelihoods of continuing the bearish pressure in the upcoming period, especially when surpassing EMA50’s support, which supports limiting the losses until now.
Gold price surpasses the range of bullish corrective channel- Analysis-13-04-2026
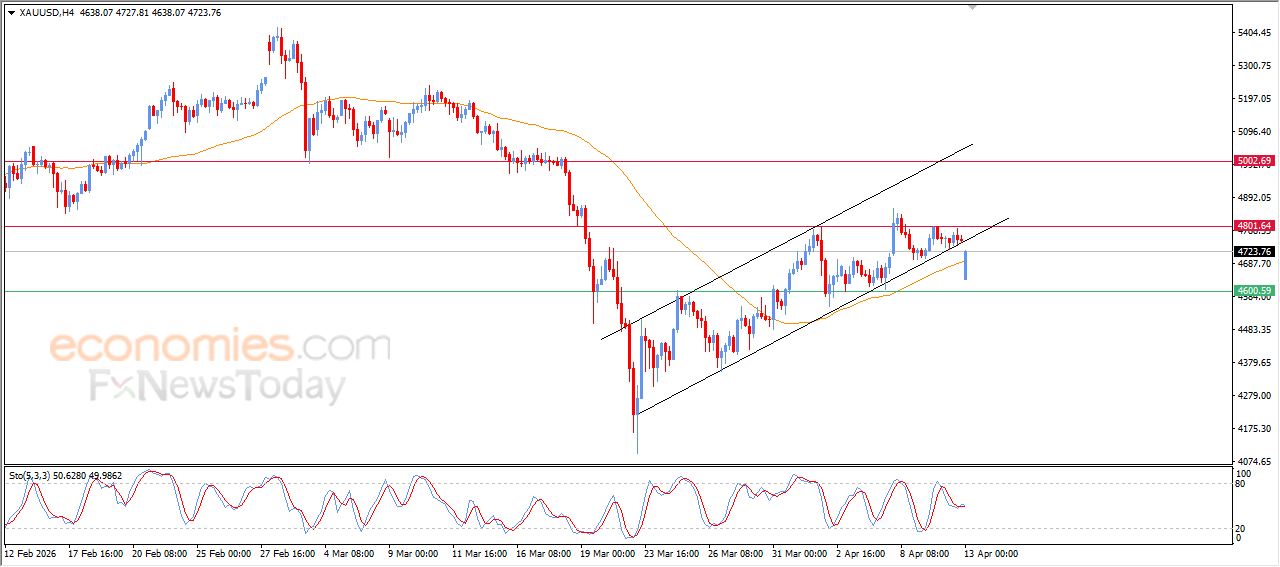
Gold managed to reduce its losses that occurred at the beginning of the week, benefiting from its stability on EMA50’s support, which provided dynamic support that helped it recover some positive momentum and pushed it to rebound quickly.
There is negative pressure after exiting bearish corrective channel’s range that was organizing its moves on the short-term basis, besides the negative signal’s emergence from the relative strength indicators, which might limit the recovery chances and keep the likelihoods of moving lower in the near upcoming trading.
EURUSD price opens the week with bearish price gap - Analysis-13-04-2026
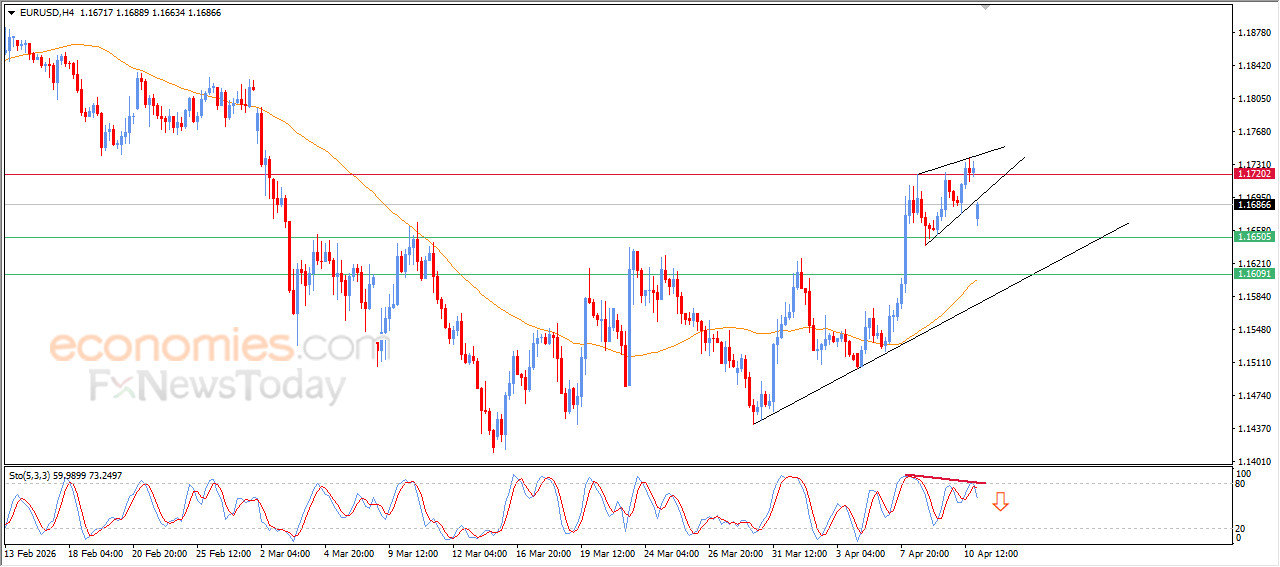
The (EURUSD) slipped lower at the beginning of this week’s trading, recording bearish price gap that led to breaking technical formation on an intraday basis, represented by a rising wedge pattern, indicating the selling pressures. This movement was accompanied by negative divergence emergence on the relative strength indicators, which confirmed by the negative signals’ appearance, reinforcing the likelihoods of continuing the bearish pressure in the near period.
Despite this negativity, there are some supportive factors that remain valid, where the price continues its trading above EMA50, which represents key dynamic support, besides the continuation of the bullish corrective trend and the trading alongside supportive trend line.
Evening update for Bitcoin -10-04-2026
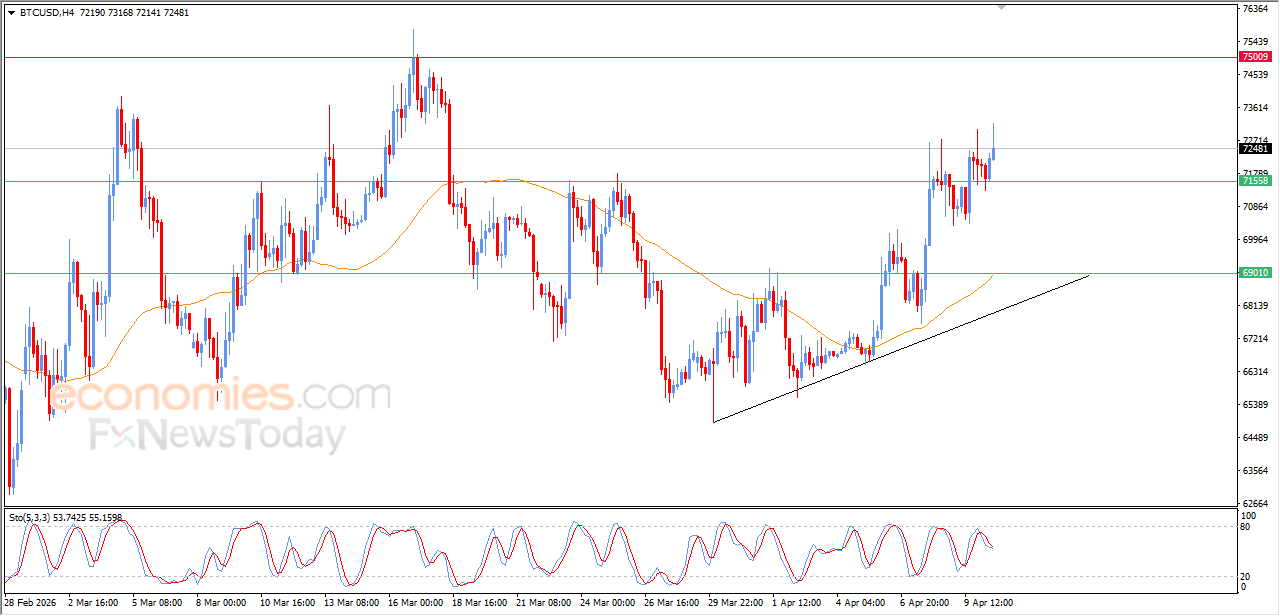
Bitcoin’s price has extended its gains during recent intraday trading, confirming a breakout above the key resistance level at $71,500.
The price remains supported by continued trading above EMA50, alongside a short-term bullish wave, moving alongside a bullish trendline that reinforces this positive structure. on the other hand, negative signals are beginning to appear on relative strength indicators after reaching overbought levels, which limited the recent upside momentum.