Monero Coin price returns lower - Analysis - 09-04-2026
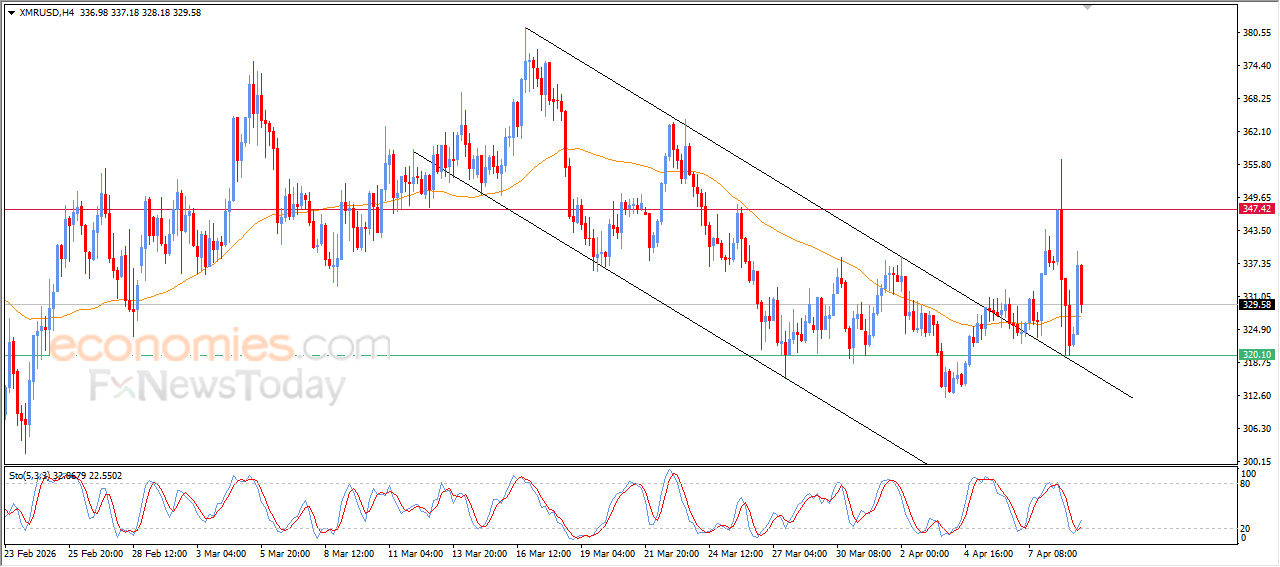
Monero (XMRUSD) price resumed its decline in its latest intraday trading, continuing its attempts to gain positive momentum that could help it recover and move higher again. The price is currently resting on the support of its 50-day SMA, while being affected by its earlier breakout from a descending price channel that had limited its short-term movements. This comes as positive signals begin to emerge from the Stochastic indicator after reaching deeply oversold levels.
Therefore we expect the cryptocurrency price to rise during its upcoming intraday trading sessions, as long as support at $320.00 remains intact, targeting the resistance level at $347.50.
Today’s price forecast: Bullish
BlackRock price pierces ceiling of positive technical pattern - Forecast today - 09-04-2026
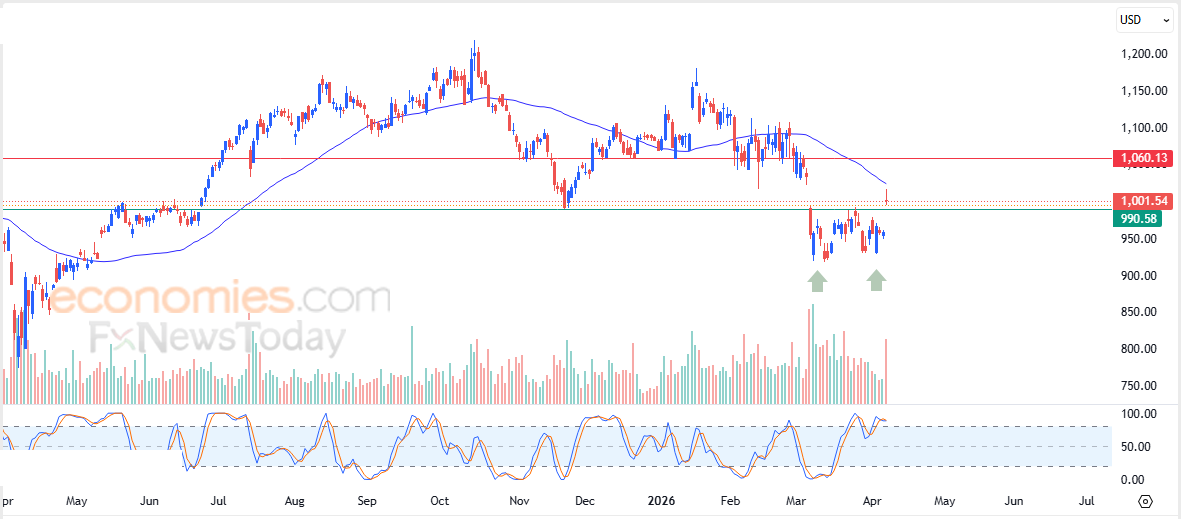
BlackRock, Inc. (BLK) stock price surged in its latest intraday trading, succeeding in breaking above the key and psychological resistance level of $1,000. This resistance represents the ceiling of a positive technical pattern formed at the end of a short-term corrective bearish wave, represented by a double bottom, accompanied by a noticeable increase in trading volumes—a technical signal confirming the validity of this breakout. The price is currently in contact with resistance at its 50-day SMA, as it attempts to overcome this negative pressure.
Therefore we expect the stock price to rise during its upcoming trading sessions, especially as long as it remains stable above $1,000, targeting the resistance level at $1,060 as a price target for the formed double bottom pattern.
Today’s price forecast: Bullish
Alphabet price shakes off negative pressure - Forecast today - 09-04-2026
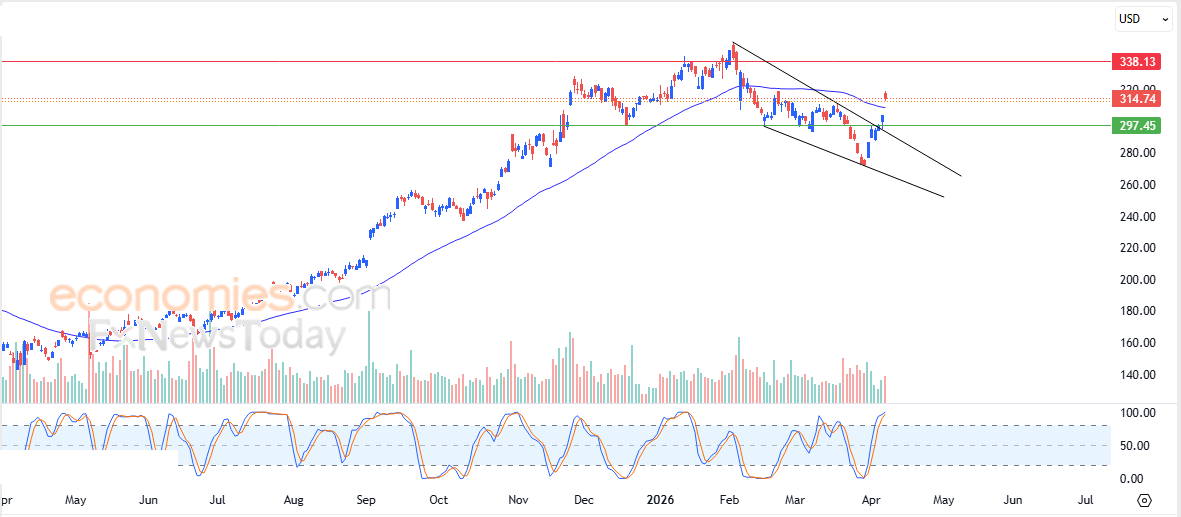
Alphabet Inc. (GOOG) stock price extended its gains in its latest intraday trading, after breaking out of a positive technical pattern formed in the short term, represented by a falling wedge. The price is driven by positive signals emerging from the Stochastic indicator, as the stock’s latest rise succeeded in moving above the resistance of its 50-day SMA, thereby overcoming its negative pressure and signaling a recovery in the coming period.
Therefore we expect the stock price to rise during its upcoming trading sessions, as long as it remains stable above support at $297.45, targeting the key resistance level at $338.00 as a price target for the formed falling wedge pattern.
Today’s price forecast: Bullish
Nu Holdings price trims gains - Forecast today - 09-04-2026
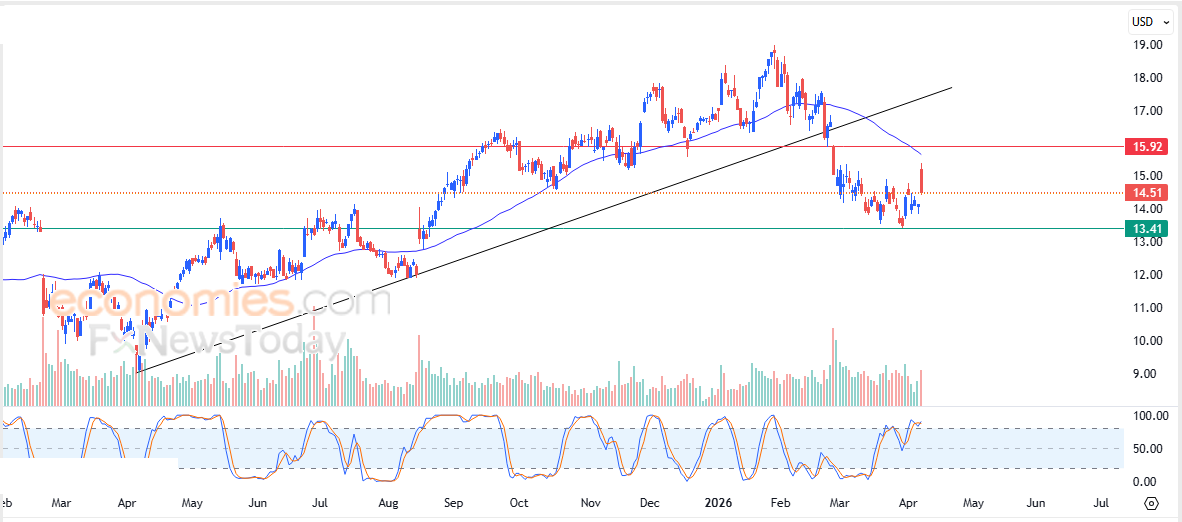
Nu Holdings Ltd. (NU) stock price recorded gains in its latest intraday trading, as the stock’s rise brought it into contact with resistance at its 50-day SMA. This exposed the stock to negative pressure, causing it to bounce lower and trim much of its early gains, amid the dominance of a short-term corrective bearish wave. In the background, negative signals are beginning to emerge from the Stochastic indicator after reaching extremely overbought levels, which adds more negative pressure to the stock’s upcoming movements.
Therefore we expect the stock price to decline during its upcoming trading sessions, as long as resistance at $15.90 remains intact, targeting the support level at $13.40.
Today’s price forecast: Bearish