EURUSD price gives up its gains amid negative technical signals- Analysis-13-01-2026
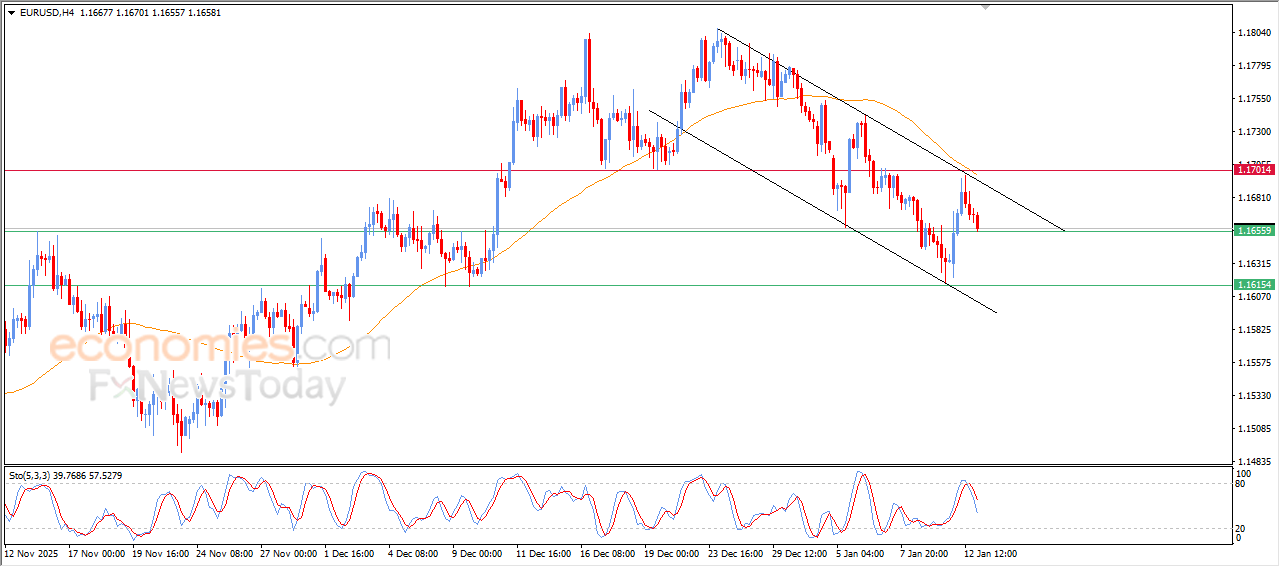
The (EURUSD) price declined in its last intraday trading, after retesting 1.1700 key resistance, accompanied by reaching the resistance of EMA50, which reinforced the negative pressures, and caused the price to decline after it failed to settle above these levels.
This performance comes amid the trading within bearish corrective channel’s range on the short-term basis, which limits the quick recovery, especially with the emergence of the negative signals from the relative strength indicators after reaching overbought levels, which suggests the continuation of the selling pressures in the near period.
Evening update for Bitcoin -12-01-2026
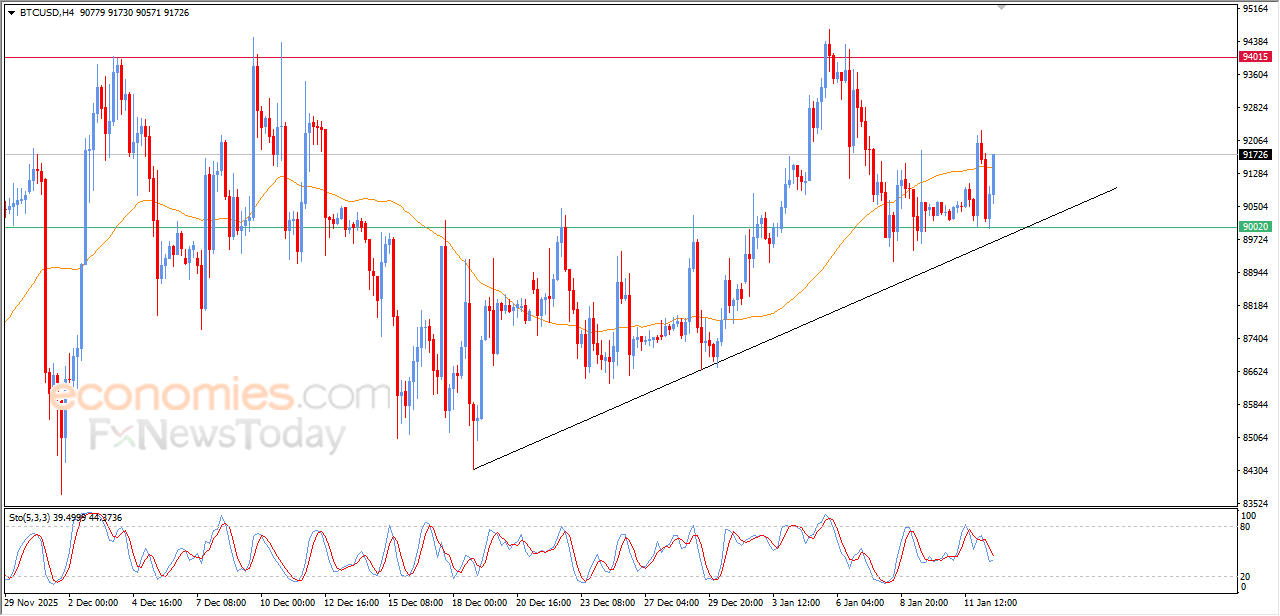
The (BTCUSD) rose in its last trading on the intraday levels, with severe fluctuation attempting to get rid of the negative pressure of EMA50, after offloading its overbought conditions on the relative strength indicators, amid the dominance of the bullish trend on the short-term basis and its trading alongside supportive trend line for this trend.
Evening update for crude oil -12-01-2026
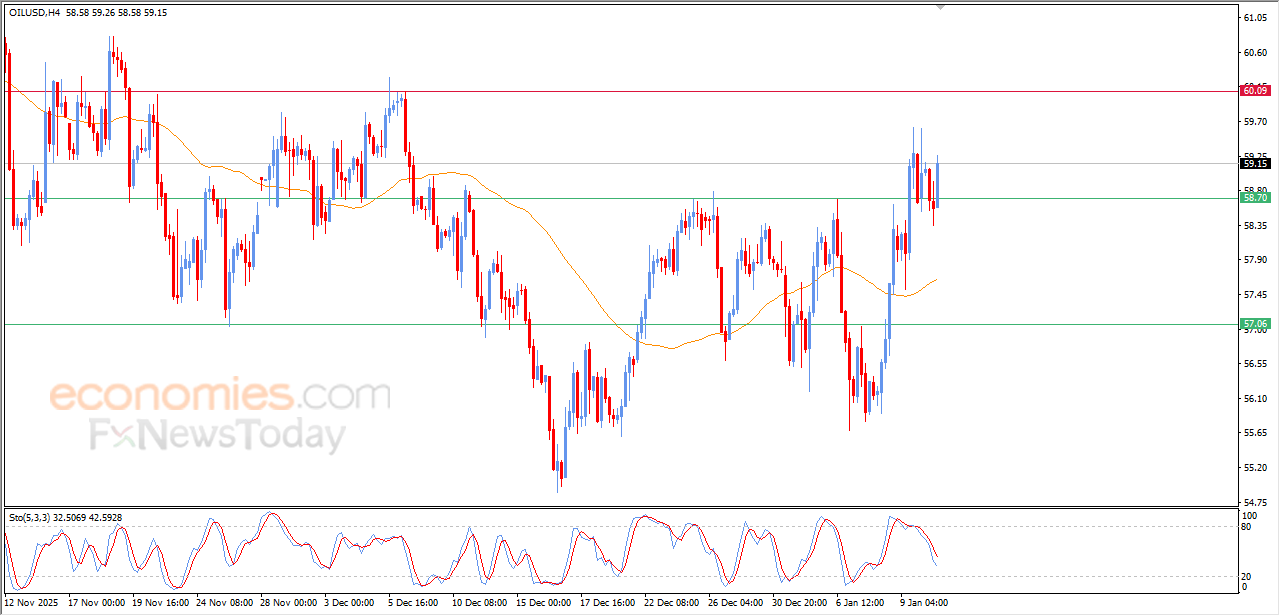
The (crude oil) price rose in its last intraday trading, recovering after gaining bullish momentum and it succeeded in offloading its overbought conditions on the relative strength indicators, amid the dominance of the bullish corrective trend on the short-term basis, with the continuation of the dynamic pressure that is represented by its trading above EMA50.
Evening update for Gold -12-01-2026
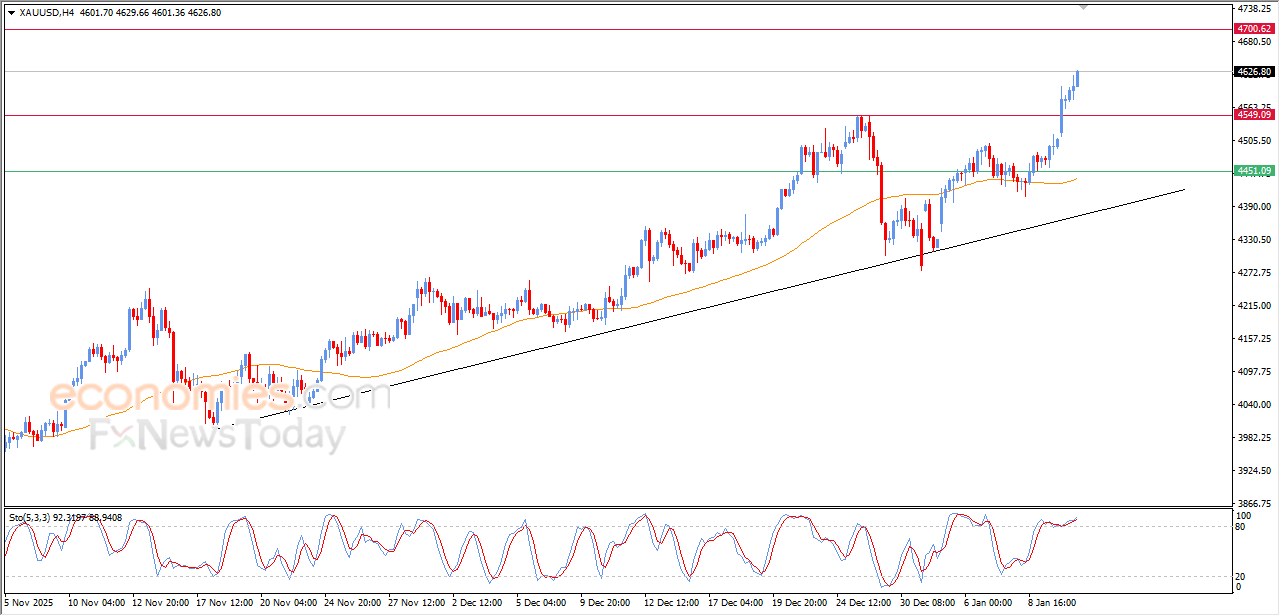
(Gold) continues the rise in the last intraday trading, to gather new all-time highs amid the dominance of the main bullish trend on the short-term basis and its trading alongside supportive trend line for this trend, with the emergence of the positive signals from the relative strength indicators, despite reaching overbought levels, indicating the strength of the bullish momentum.