Evening update for EURUSD-26-03-2026
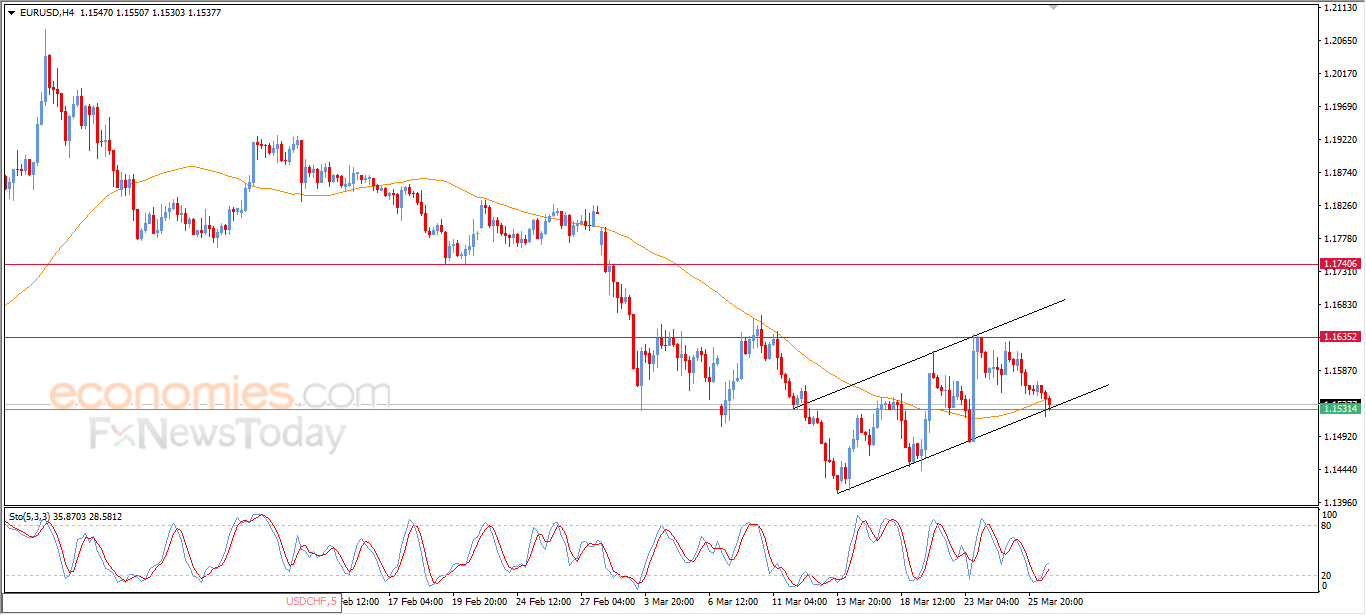
(EURUSD) prices deepened its losses in their last intraday trading, to lean on EMA50, accompanied by its stability on the support of bullish corrective channel that limits its previous trading on the short-term basis, as a last attempt to gain bullish momentum that might help it to recover and rise again, this scenario is supported by positive divergence on the relative strength indicators, after reaching oversold levels, exaggeratedly compared to the price move, with the emergence of the positive signals from them.
Forecast update for Ethereum -26-03-2026
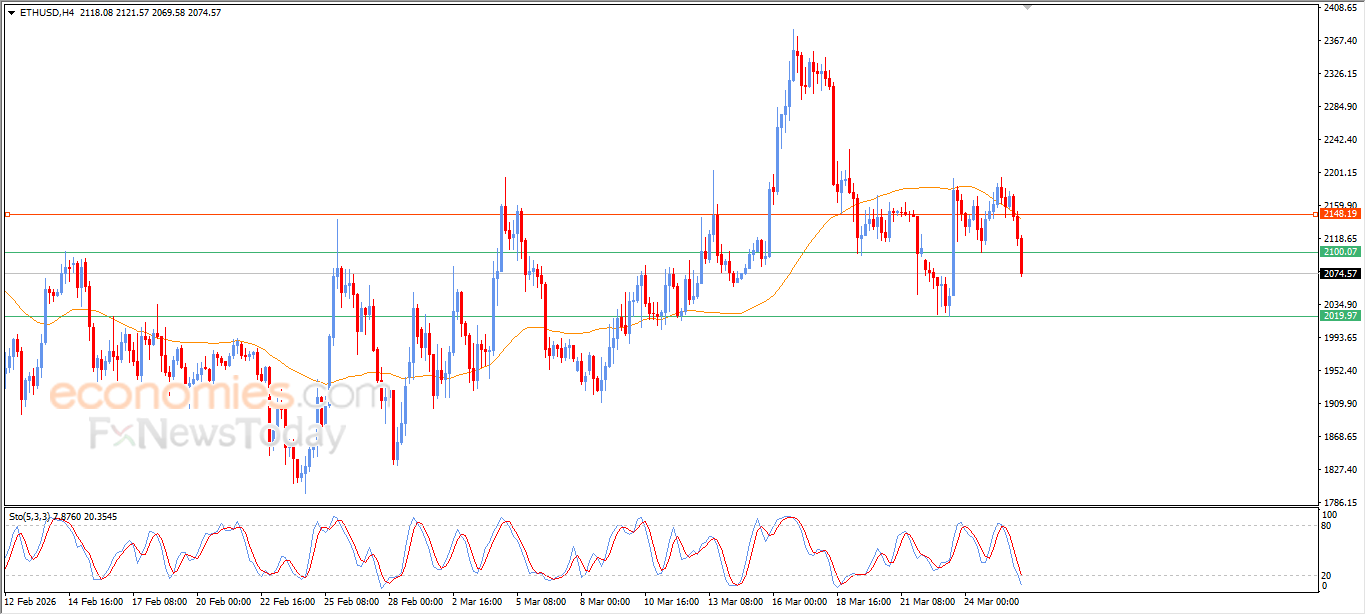
Ethereum price (ETHUSD) moved lower during its recent intraday trading, deepening its early losses for the day after failing to overcome the negative pressure from EMA50. This led to a break below the key support level at $2,100, signaling a clear intention for further downside, especially with continued negative signals from the relative strength indicators.
Forecast update for Brent -26-03-2026
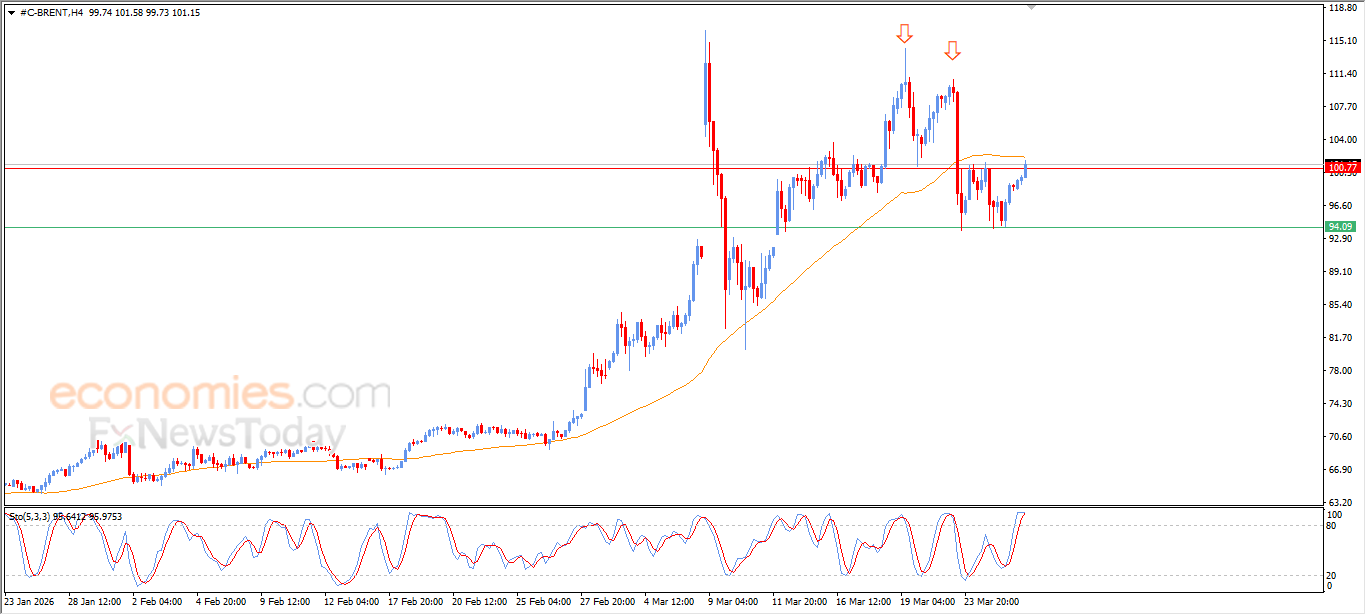
Brent crude oil (Brent) moved higher in its recent intraday trading, retesting the key resistance level at $100.80. This level represents the neckline of a previously formed bearish pattern (double top) on the short-term timeframe.
This move comes as the price also faces resistance from EMA50, increasing negative pressure and signaling a potential bearish reversal, especially with early signs of a negative crossover on the relative strength indicators after reaching heavily overbought levels.
Forecast update for Bitcoin -26-03-2026
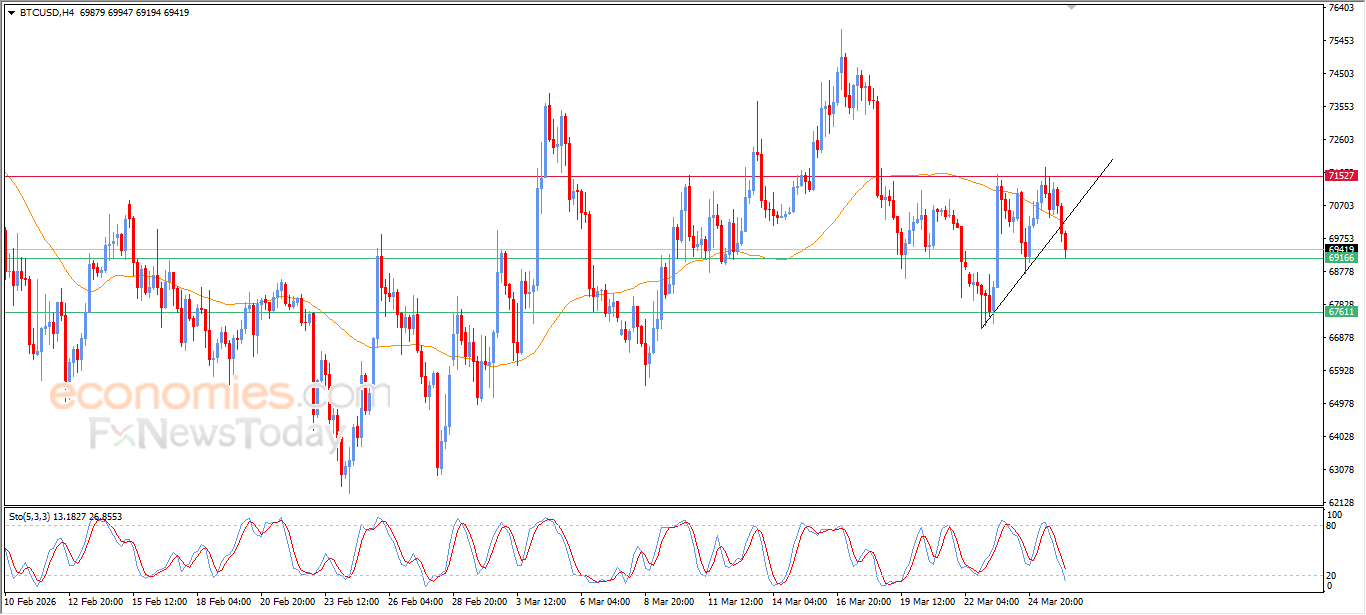
Bitcoin price (BTCUSD) continued to decline during its recent intraday trading, pressured by ongoing negative signals from the relative strength indicators. The price has also broken below EMA50, exposing it to further downside pressure, especially as this move coincided with a break of a short-term ascending trendline, increasing the likelihood of deeper losses in the near term.