GBPUSD price keeps declining- Analysis-21-11-2025
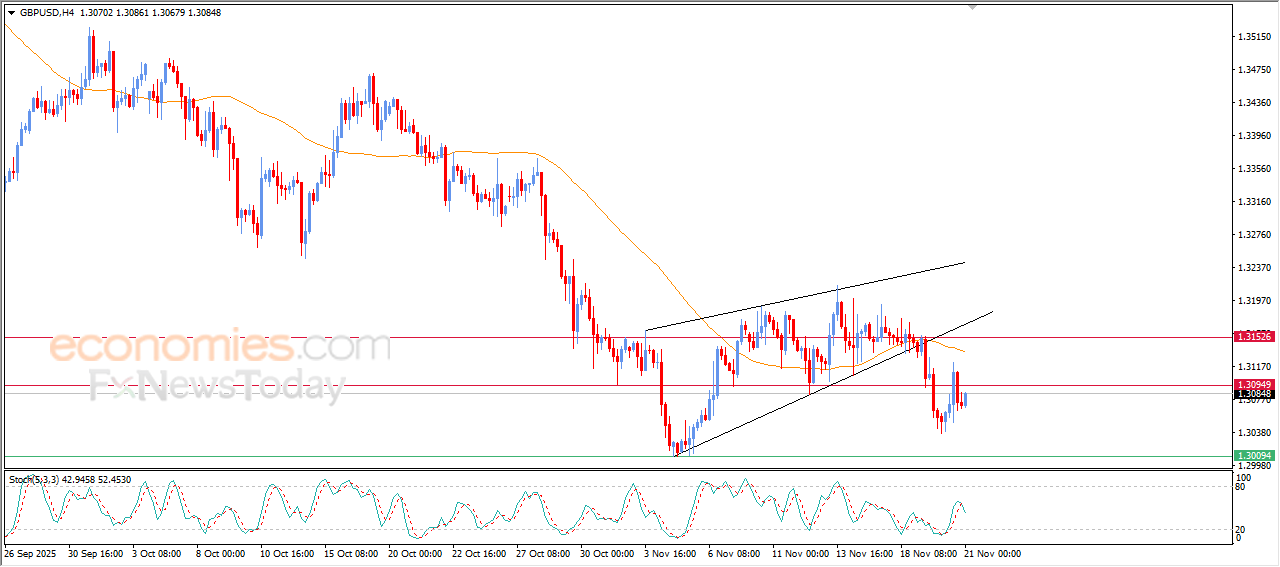
The (GBPUSD) price rose slightly in its last intraday trading, amid the continuation of the negative pressure due to its trading below EMA50, affected by negative technical formation that formed on the short-term basis(the rising wedge pattern), besides forming negative divergence on the relative strength indicators, after reaching overbought levels, with the emergence of the negative signals on the relative strength indicators.
(BTCUSD) is getting ready to break our expected target- Analysis-21-11-2025
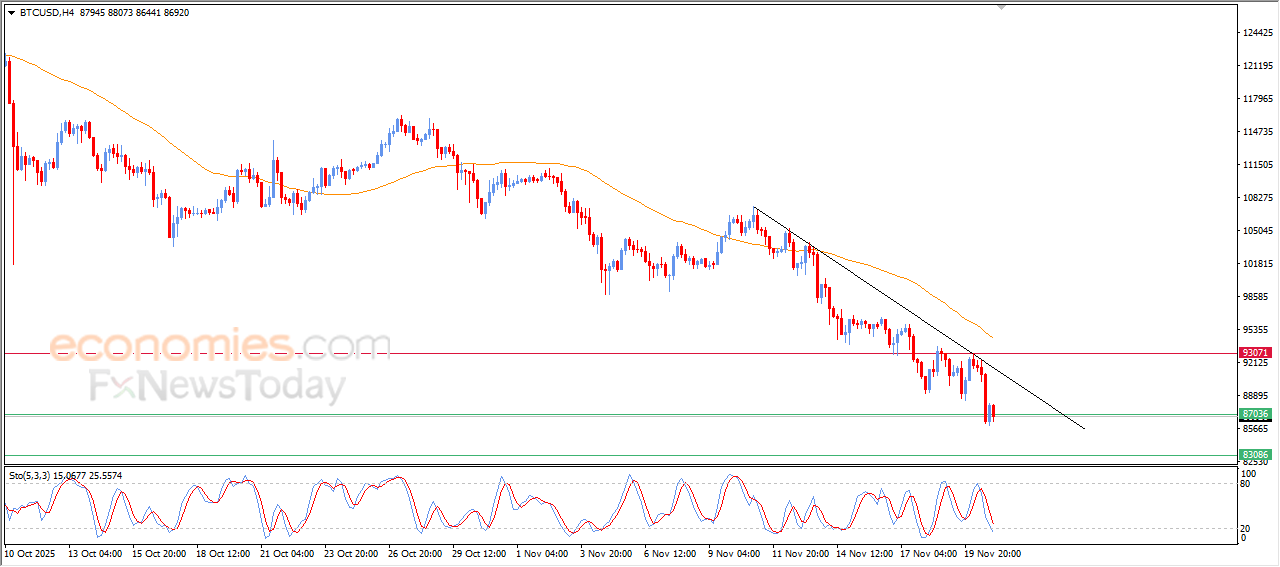
Bitcoin (BTCUSD) declined in its last intraday trading, nearing a break of the $87,000 support, which represents our expected bearish target. The ongoing negative pressure from stability below the EMA50 strengthens sellers’ control, supported by trading along a minor trend line that maintains the short-term bearish bias.
Crude oil prices surrender to the negative pressure- Analysis-21-11-2025
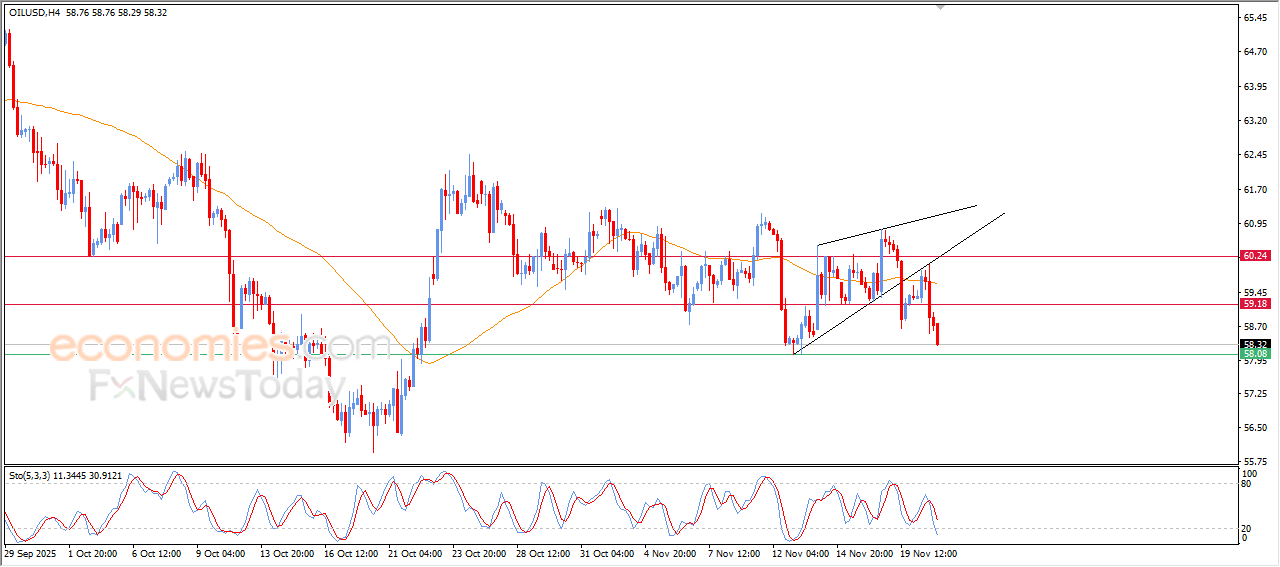
Crude oil prices extended their decline in the last intraday trading, breaking the $59.20 support under the impact of the previously formed negative pattern on the short-term chart, represented by the falling wedge. This breakdown strengthens selling pressure, especially with prices holding below the EMA50, which blocks any meaningful recovery attempts.
Negative signals are also shown on relative strength indicators despite oversold readings, confirming the continued weakness of bullish momentum and keeping sellers in control while the market awaits a clear signal indicating a new low or a deeper bearish wave.
Gold prices are looking for its upcoming trend- Analysis-21-11-2025
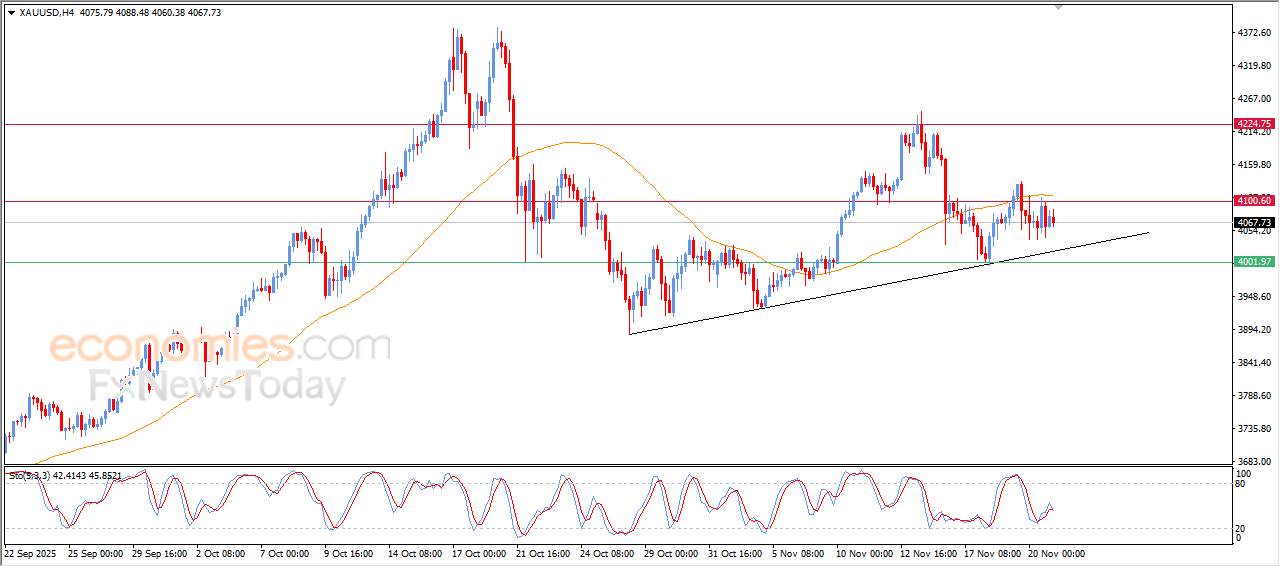
Gold declined in its last intraday trading due to ongoing negative pressure from trading below the EMA50, which signals weak bullish momentum. This drop appears alongside renewed negative signals on relative strength indicators after exiting oversold areas, allowing sellers to control the near-term movement.
Despite this pressure, the main bullish trend still dominates the short term, supported by trading along the minor trend line. The contrast between intraday negativity and the broader bullish structure keeps technical signals neutral, awaiting a clear breakout to define the next direction.