GBPUSD price prepares to break key support- Analysis- 09-03-2026
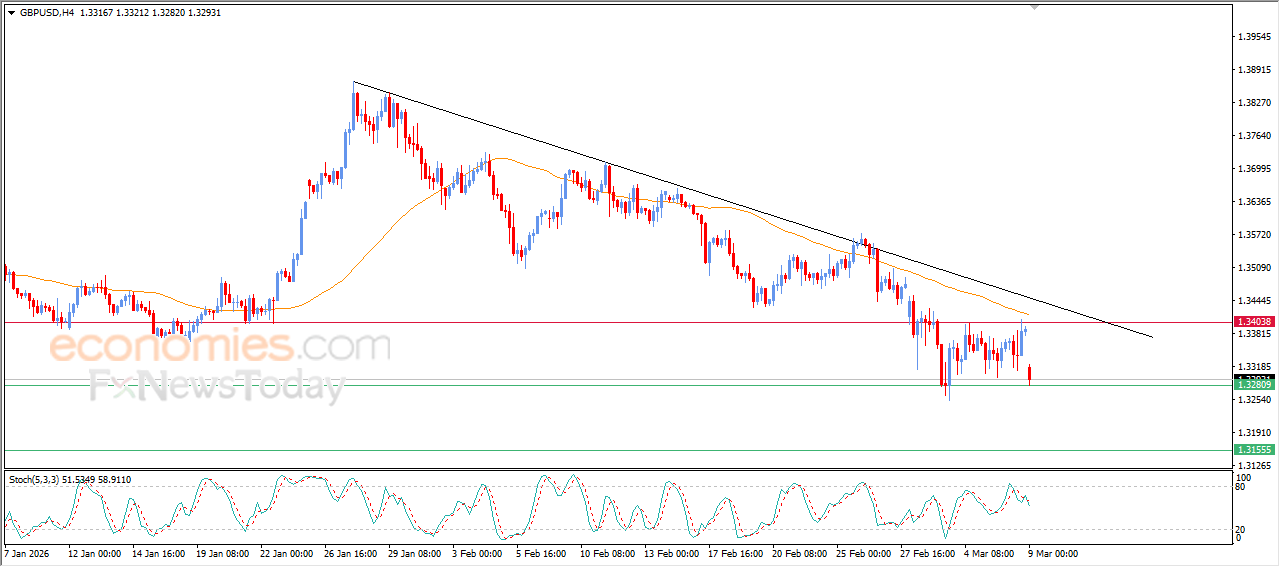
The GBPUSD pair slipped lower during its latest intraday trading, reaching the support level of 1.3280. This support level had been a price target in our previous analysis in preparation for a potential break, amid continued negative pressure as the pair trades below EMA50. This reinforces the stability and dominance of the main short-term bearish trend, especially as price movements continue along a trendline that supports this path.
In addition, we notice the emergence of negative signals from the relative strength indicators after reaching heavily overbought levels.
Bitcoin (BTCUSD) faces negative pressure- Analysis-09-03-2026
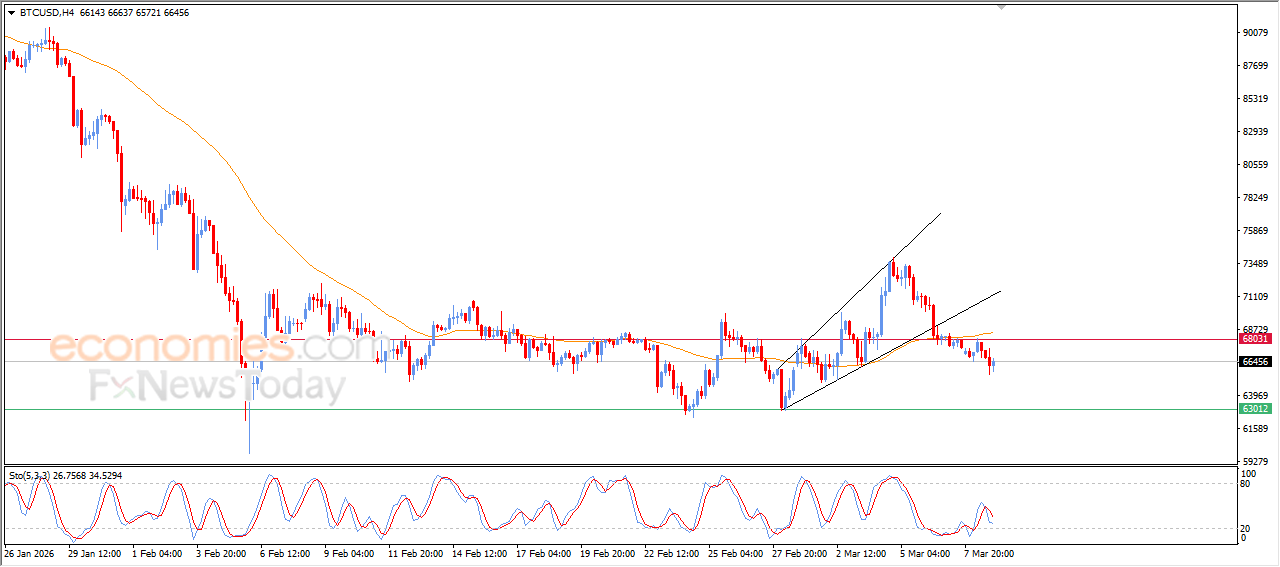
Bitcoin price (BTCUSD) is experiencing volatile movements during its latest intraday trading, amid continued negative pressure by trading below EMA50, which represents a dynamic resistance limiting recovery opportunities in the near term.
The price is also affected by a negative technical formation that appeared earlier in the short term, represented by a broadening wedge pattern, reflecting a state of technical instability. In the background, negative signals Emerge from the relative strength indicators after offloading the previous oversold condition, which may open the way for further declines soon.
Crude oil prices break all resistance levels- Analysis- 09-03-2026
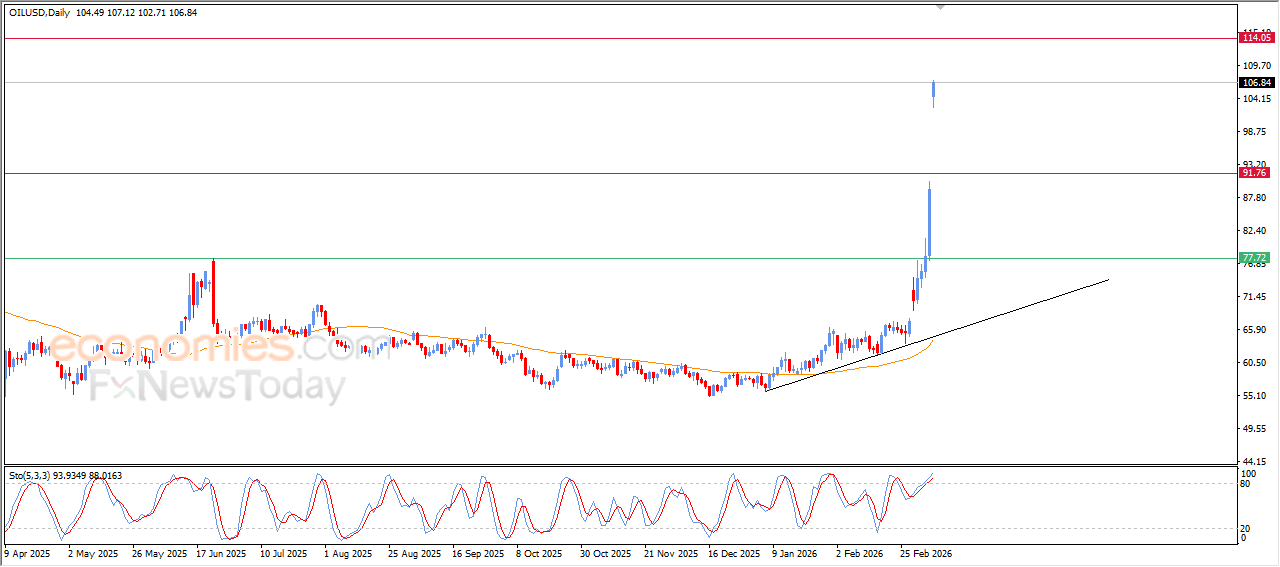
Crude Oil price surged strongly during its latest intraday trading, to breach series of resistance levels, signaling the strength of the dominant bullish momentum, amid supply concerns in the Middle East. This comes with the clear dominance of the main short-term bullish trend.
The price is getting additional support from its stability above EMA50, which provides renewed positive momentum that supports the continuation of the rise, accompanied with the emergence of positive signals from the relative strength indicators after the price managed to relieve the overbought condition that appeared earlier, giving it more room to continue expanding its gains during the current period, as shown in the attached chart for the daily timeframe.
Silver Price reaches our target– Analysis-09-03-2026
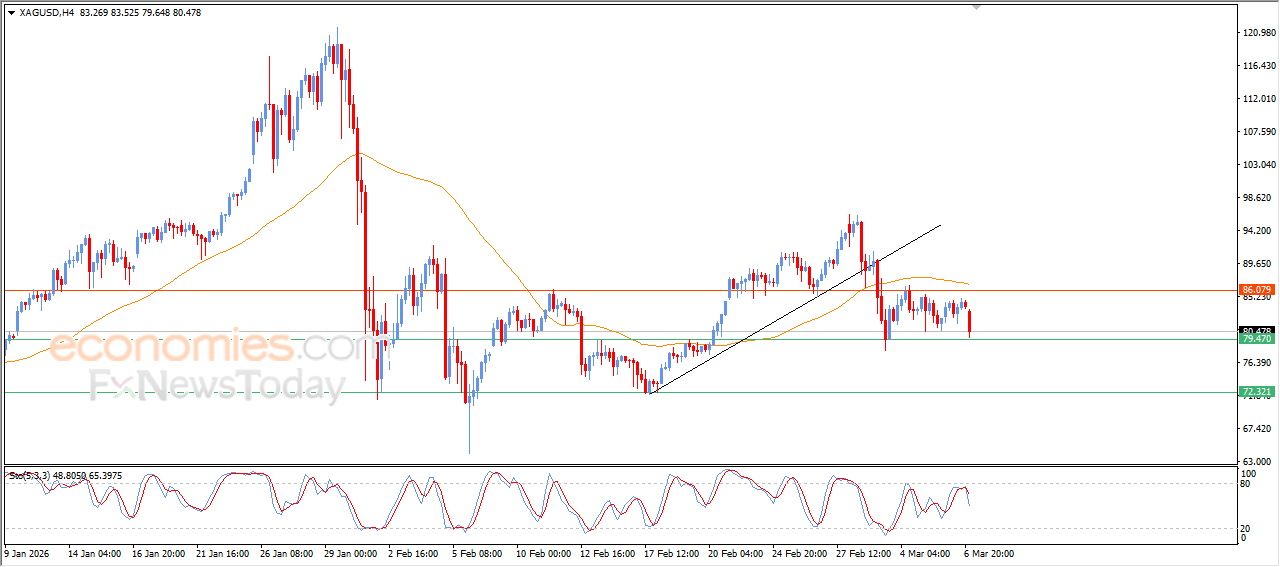
Silver price declined during its latest intraday trading, reaching the important support level of 79.50$, which represents a price target we identified in our previous analysis. This move was influenced by the emergence of negative signals from the relative strength indicators after it reached sharply overbought levels, which increased selling pressure on price movements.
This decline comes amid continued negative pressure as the price trades below EMA50, which acts as a dynamic resistance limiting recovery opportunities. The price also remains affected by its earlier break of a short-term upward corrective trendline, reinforcing the negative outlook for its movements in the near term.