The USDJPY breaks a bullish trendline -Analysis-01-04-2026
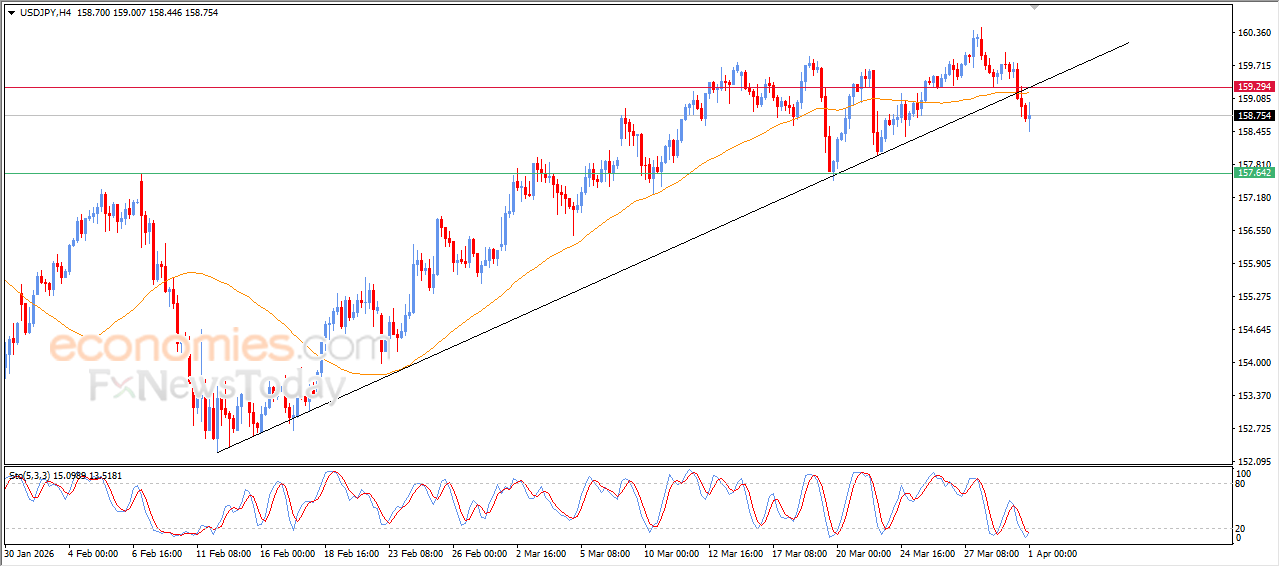
The USDJPY pair is recording consecutive losses during its recent intraday trading, confirming a break below a key short-term ascending trendline. This signals the continuation of the bearish corrective wave, especially with added negative pressure from trading below EMA50, which increases the downside pressure surrounding the pair.
On the other hand, we notice the beginning of a positive crossover of the relative strength indicators, after reaching deeply oversold levels. This helped limit recent losses and caused some price consolidation.
GBPUSD price shows more negative signs - Analysis- 01-04-2026
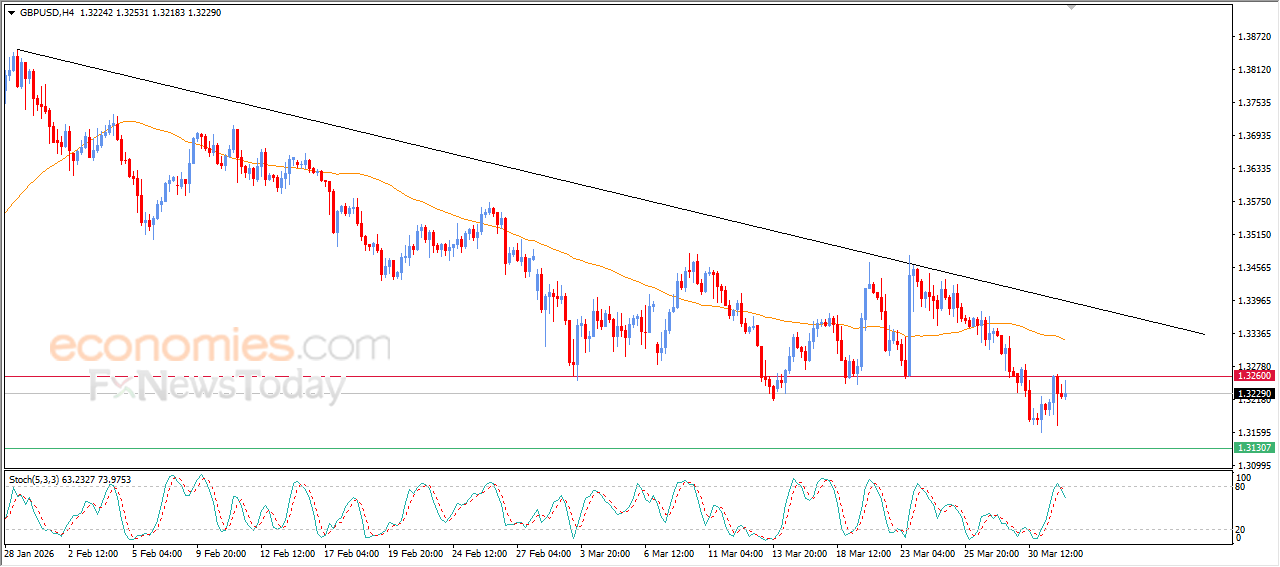
The GBPUSD pair witnessed fluctuated trading on its recent intraday levels, after retesing 1,3260 key resistance, to rebounce lower amid the continuation of the negative pressure due to its trading below EMA50, which reduces the chances of full recovery on near-term basis, especially with the dominance of the main bearish trend on short-term basis, beside the formation of negative divergence on the relative strength indicators, after reaching overbought levels, exaggeratedly compared to the price move, with the emergence of negative signals from there.
Bitcoin (BTCUSD) struggles to overcome bearish pressure - Analysis-01-04-2026
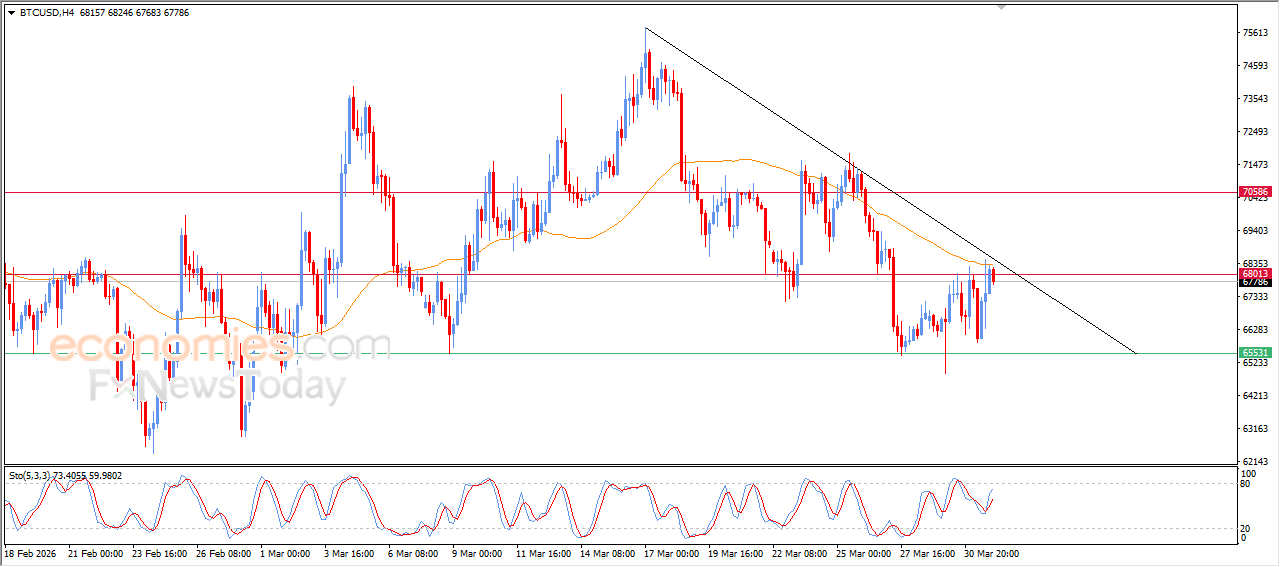
Bitcoin price (BTCUSD) is holding onto strong gains during its recent intraday trading, despite encountering resistance at the 50-period simple moving average, which has temporarily halted the recent bullish movement. This performance is supported by emerging positive signals from the relative strength indicators, after the price managed to ease its overbought condition, giving it more room to attempt resuming gains in the short term.
However, the price still faces a technical obstacle represented by a short-term descending corrective trendline, which may limit further upside movements in the coming period.
Crude oil price regains bullish momentum - Analysis- 01-04-2026
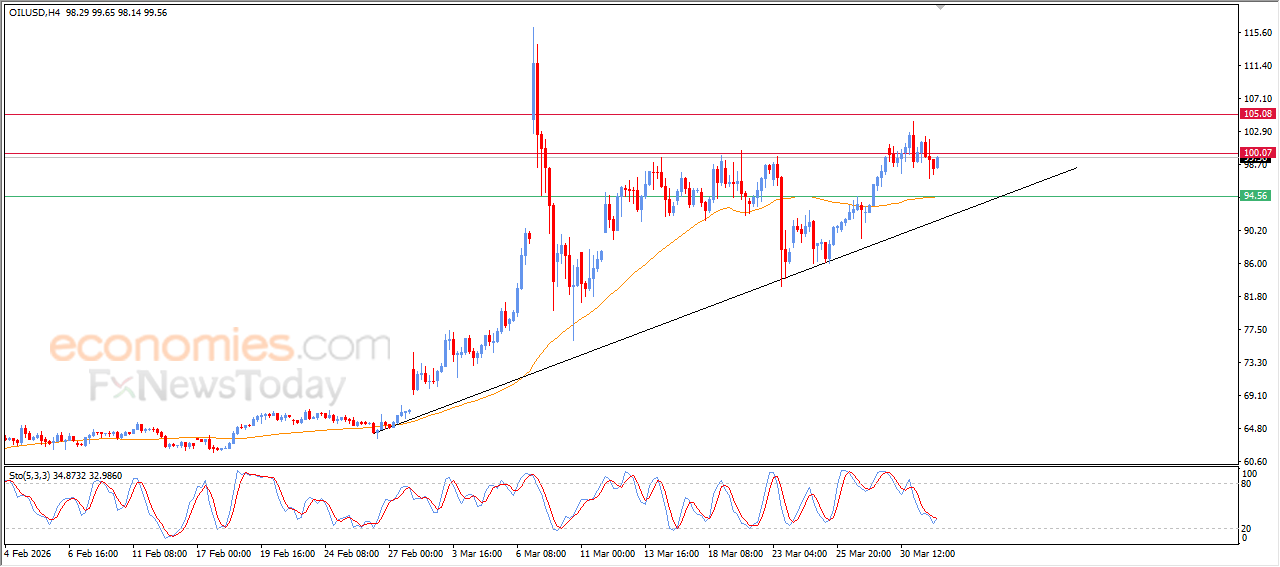
Crude oil recorded a new increase during its recent intraday trading, preparing to reach the strong resistance level at $100.00, supported by the price continuing to trade above EMA50, which provides dynamic support and reinforces the stability of the main short-term uptrend, especially as price moves along a supportive trendline.
We also notice the beginning of a positive crossover of the relative strength indicators, after it reached deeply oversold levels compared to price movement. This suggests the possibility of positive divergence forming, which strengthens the chances of continued upward movement in the coming period.