The USDJPY price finds support at key level -Analysis-14-04-2026
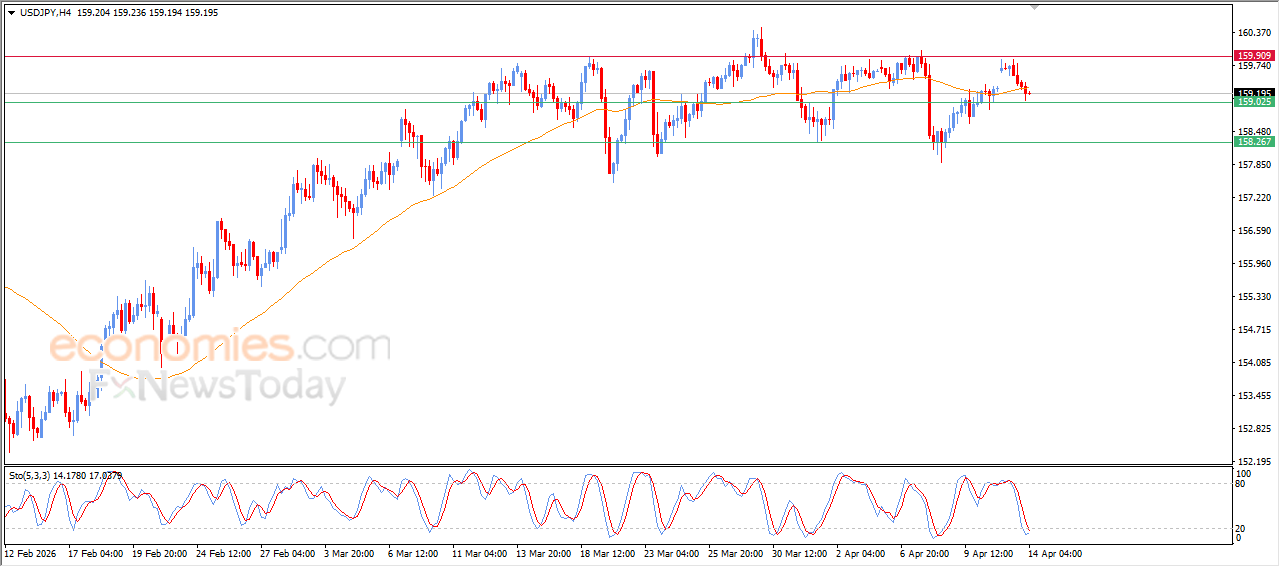
The USDJPY pair continued to decline during its latest intraday trading following the firm resistance at the key level of 159.90. The pair is now attempting to form a higher low that could serve as a base to regain positive momentum and resume its upward movement. With the recent drop, the pair has reached support at the EMA50, alongside the key support level at 159.00.
In the background, early signs of a bullish crossover are beginning to appear on relative strength indicators after reaching heavily oversold levels, excessively compared to price movement. This suggests the formation of a potential positive divergence, strengthening this area as a key support zone for the price.
GBPUSD price breaks our target level - Analysis- 14-04-2026
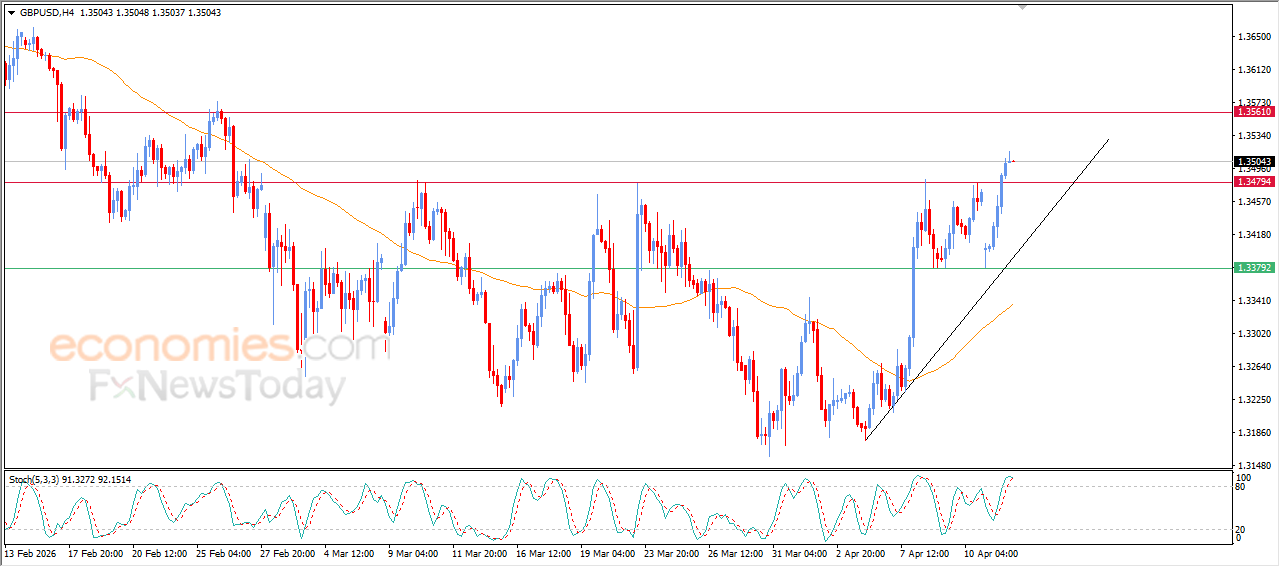
The GBPUSD pair recorded strong consecutive gains during its recent intraday trading, successfully breaking above the key and stubborn resistance level at 1.3480. This level was an expected target in our previous analysis. The pair remains under the control of a short-term corrective upward trend, moving along a supportive trendline, while continued trading above the EMA50 maintains positive pressure and reinforces the stability of this bullish path.
On the other hand, we notice the emergence of bearish crossover on relative strength indicators after reaching heavily overbought levels. This may limit the pair’s upcoming gains and could lead to some corrective pullbacks or sideways fluctuations.
Bitcoin (BTCUSD) is breaching our expected target- Analysis-14-04-2026
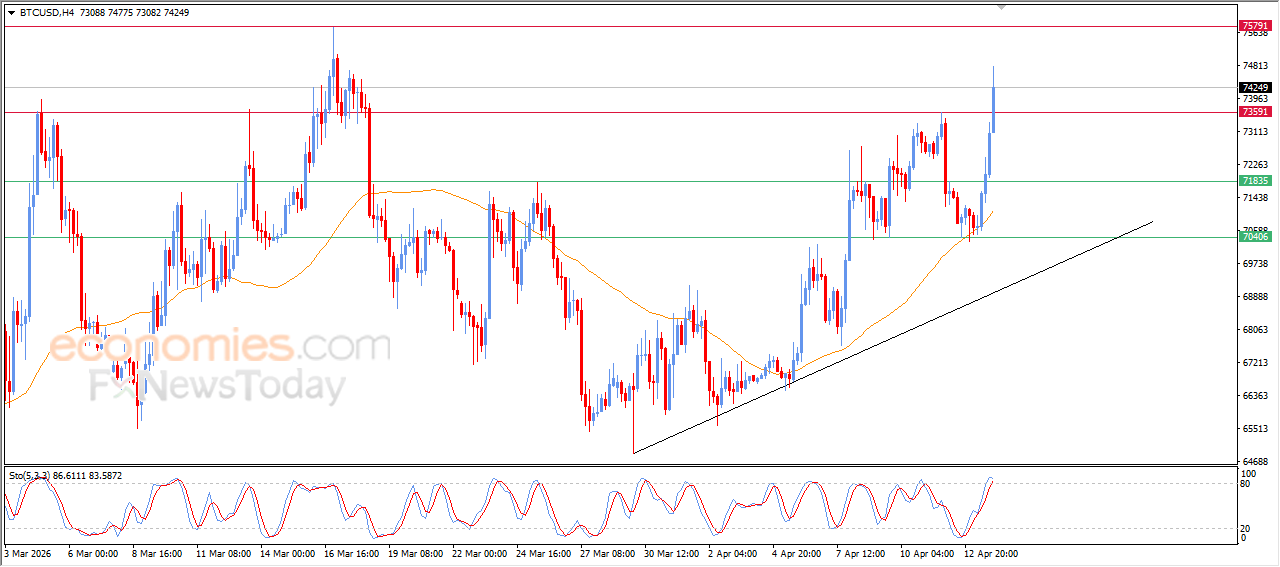
Bitcoin (BTCUSD) continued its strong bullish rally during its latest intraday trading, breaching the key resistance level at $73,500, which represented price target in previous analysis. This performance comes amid a dominant short-term uptrend, supported by the price trading above EMA50, which provides dynamic support and reinforces the stability of the positive movement.
Despite this strong momentum, some negative signals have started to appear on relative strength indicators after reaching overbought levels, with a bearish crossover forming. This may slow the pace of the upward movement and limit further gains in the near term, without invalidating the current upward trend.
Crude oil price is under negative pressure- Analysis- 14-04-2026
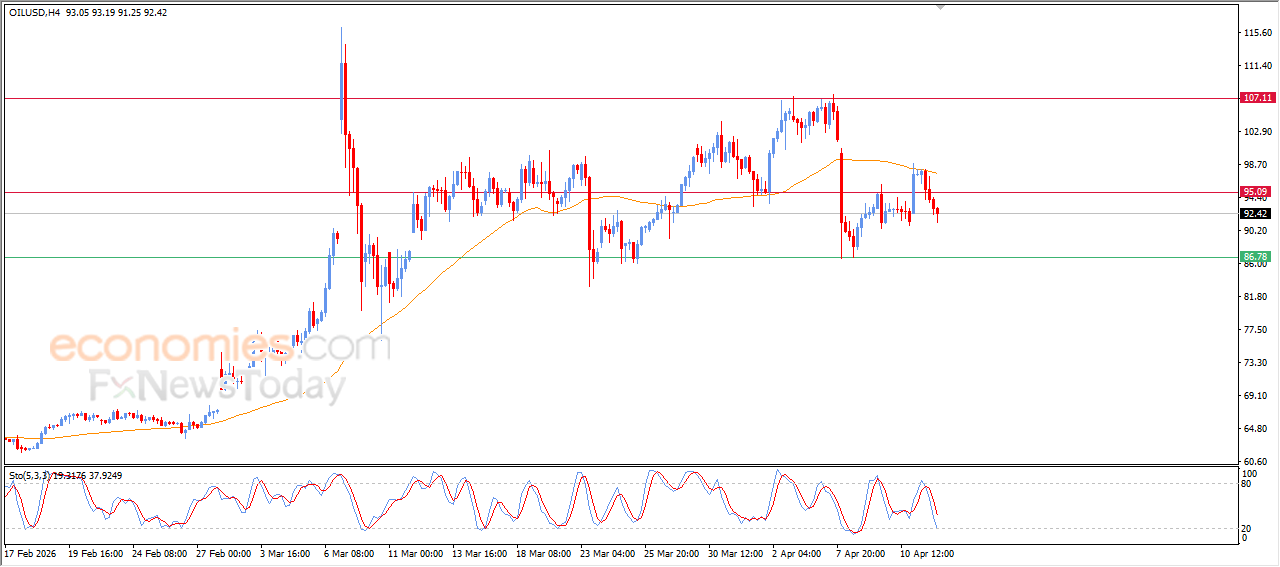
Crude oil prices continued to decline during recent intraday trading after failing to surpass EMA50, which acted as a barrier preventing further upward movement and halted previous gains. This price rejection pushed trading back below the key resistance level at $95.00, reflecting weakening bullish momentum.
This performance comes amid the dominance of a short-term corrective downward wave, alongside continued negative signals from relative strength indicators after previously reaching overbought levels. This increases the likelihood of continued downward pressure in the near term.