The USDJPY price gets rid of its negative pressure -Analysis-17-04-2026
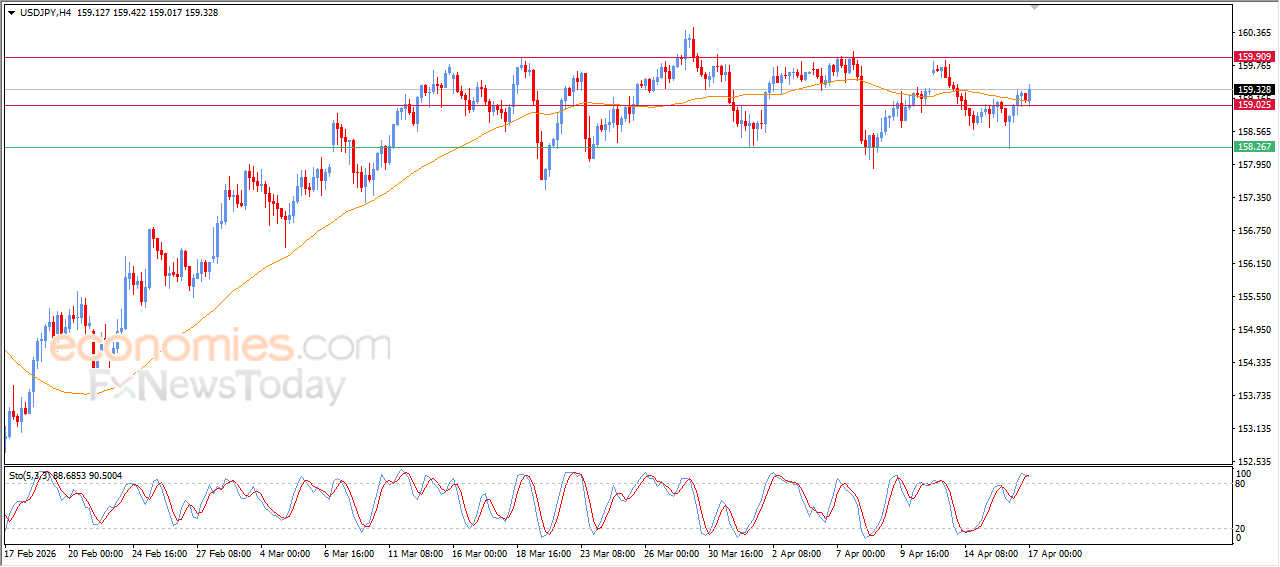
The USDJPY pair rose during its recent intraday trading, stabilizing above the resistance level of 159.00, as a signal for strong bullish intent. This move comes after surpassing the negative pressure of EMA50, enhancing the chances for a rise, especially as the main short-term trend remains bullish.
On the other hand, relative strength indicators are beginning to show a bearish crossover after reaching heavily overbought levels, which may limit the pair’s upcoming gains.
GBPUSD price attempts to gain positive momentum- Analysis- 17-04-2026
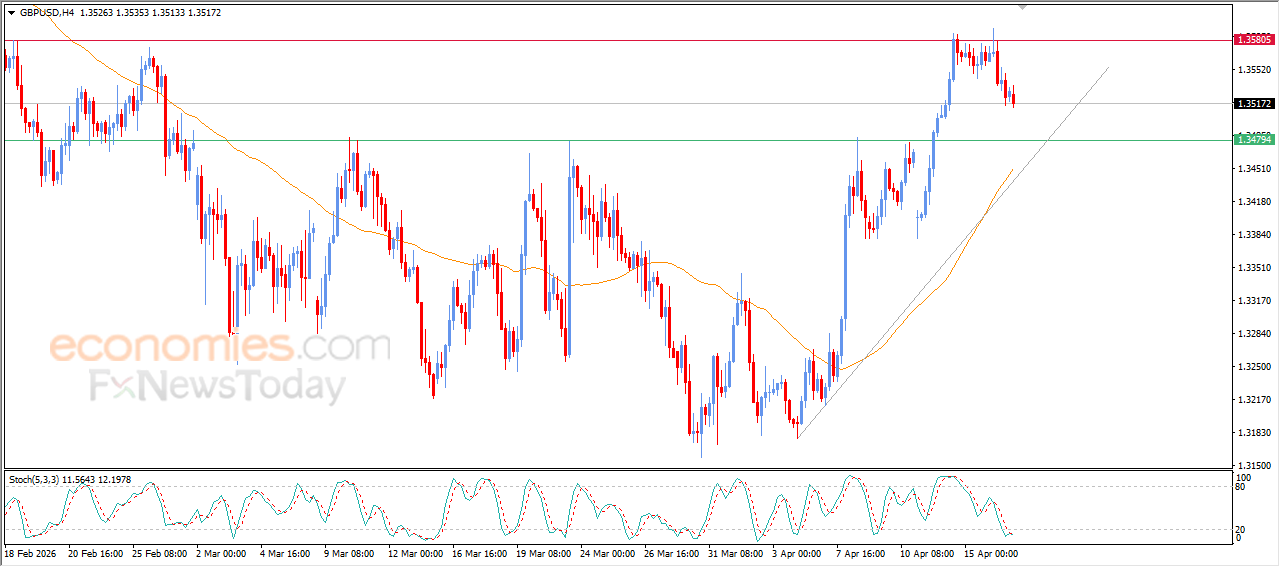
The GBPUSD pair declined during its recent intraday trading, as it attempts to form a higher low that could serve as a base to regain the positive momentum needed for recovery. This comes within the dominance of a short-term bullish trend, with continued positive pressure as the pair trades above EMA50.
Meanwhile, relative strength indicators are beginning to show a positive crossover after reaching heavily oversold levels compared to the pair’s price movement, suggesting the early formation of a bullish divergence. This supports the chances of a price recovery in the near term.
Bitcoin (BTCUSD) prepares to attack a key resistance - Analysis-17-04-2026
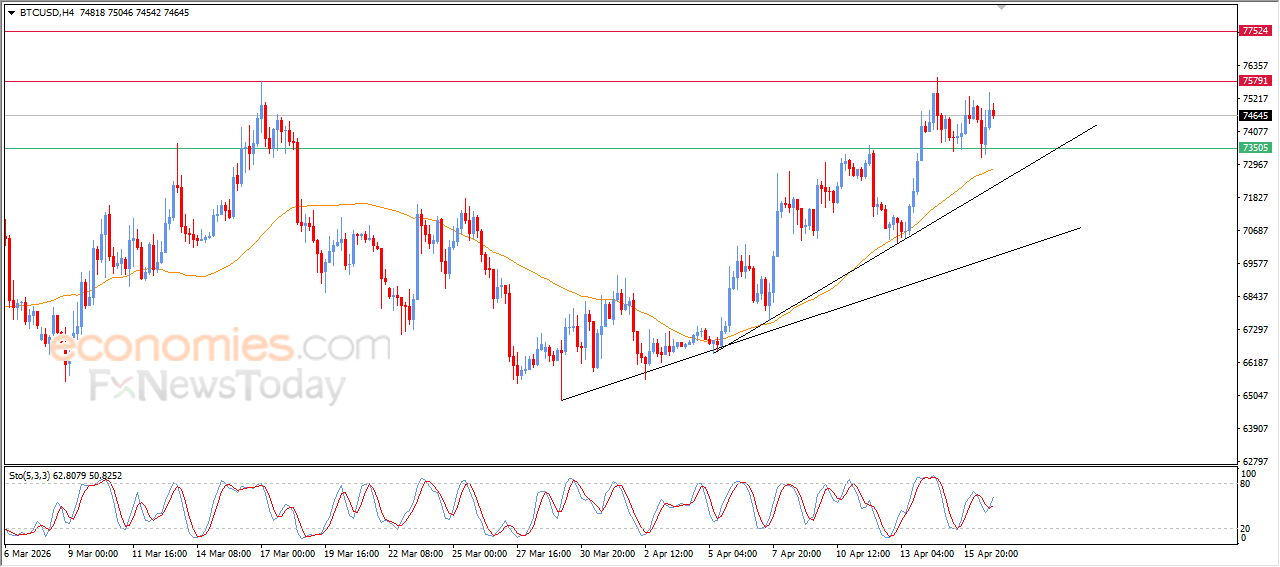
Bitcoin price (BTCUSD) is holding onto clear gains during its recent intraday trading, as it prepares to challenge the key resistance level at $75,500. This comes with continued trading above EMA50, which provides dynamic support and reinforces the stability of the main short-term bullish trend.
The price is also moving along major and minor upward trendlines that support this trajectory, alongside a series of positive signals from relative strength indicators. This reflects strong bullish momentum and supports the likelihood of continued bullish movement in the coming period, especially if the price succeeds in breaking the targeted resistance level.
Crude oil price begins to show new negative signals- Analysis- 17-04-2026
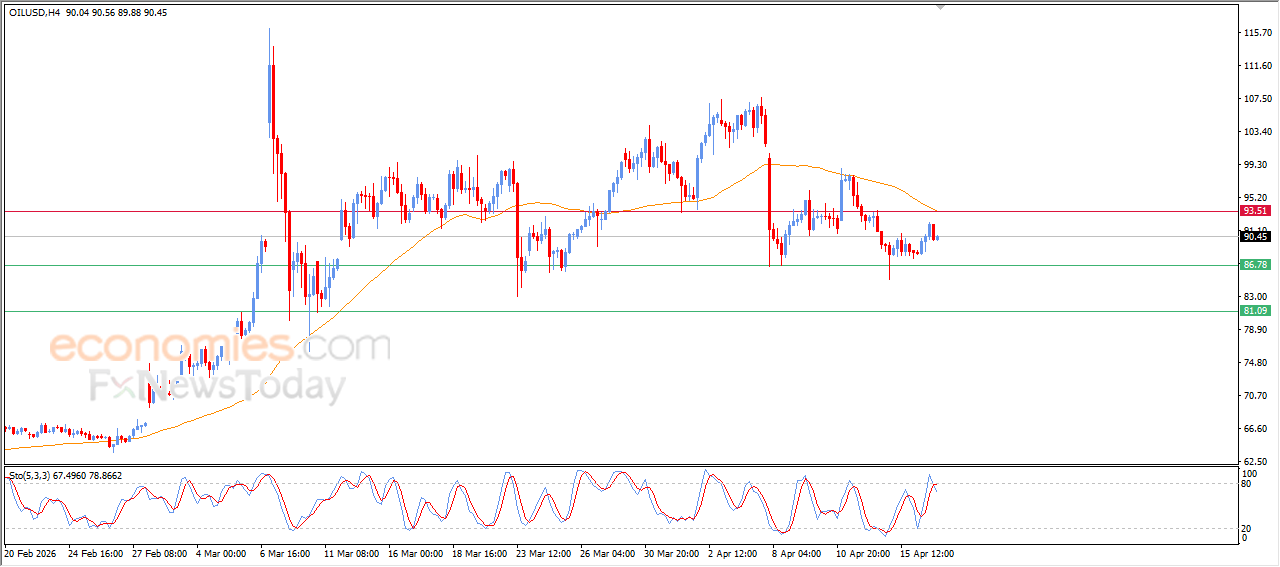
Crude oil price declined during its recent intraday trading, as the short-term bearish corrective trend continues to dominate. The price remains under clear negative pressure due to trading below EMA50, which continues to limit any recovery attempts.
Negative pressure is also increasing with the emergence of a bearish crossover on relative strength indicators after reaching overbought levels compared to price action. This suggests forming a bearish divergence, which could support the continuation of the decline in the near term.