American International price suffers from negative pressures - Forecast today - 25-07-2025
AI Summary
- American International Group, Inc (AIG) has experienced a decline in recent intraday trading, breaking below the current support level at $79.77
- The stock is under the influence of a short-term corrective downtrend, with negative pressure driven by trading below the 50-day SMA and a bearish crossover forming in the Relative Strength Index
- The stock is expected to decline in upcoming sessions, targeting the next support level at $76.00 as long as it remains below $79.77. Today's price forecast is bearish.
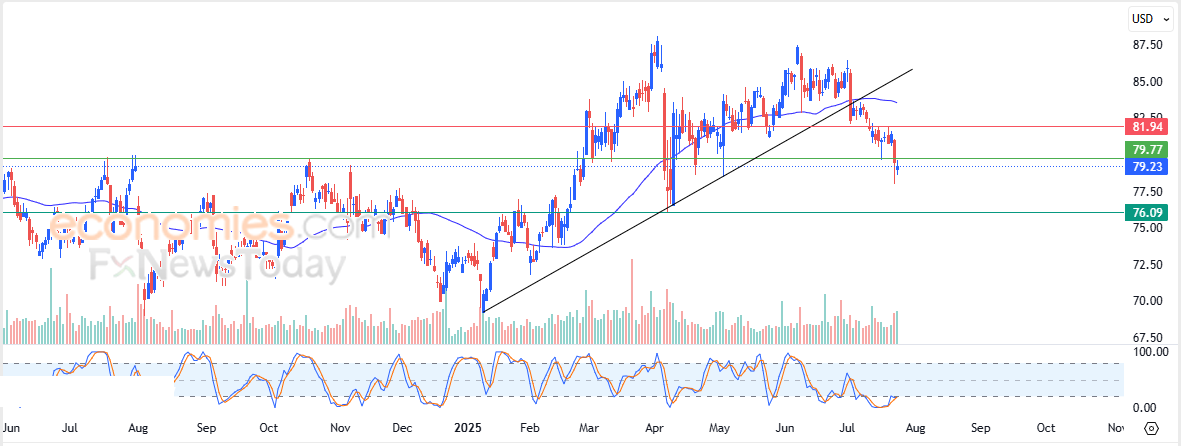
American International Group, Inc (AIG) declined in its recent intraday trading, breaking below the current support level at $79.77. The stock remains under the influence of a short-term corrective downtrend, having previously broken a major ascending trendline. Continued negative pressure is also driven by trading below the 50-day SMA. Additionally, a bearish crossover is beginning to form in the Relative Strength Index, after the stock successfully relieved previous oversold conditions, paving the way for further losses.
Therefore we expect the stock to decline in upcoming sessions, especially as long as it remains below $79.77, targeting the next support level at $76.00.
Today’s price forecast: Bearish.
Forecast update for Ethereum -25-07-2025
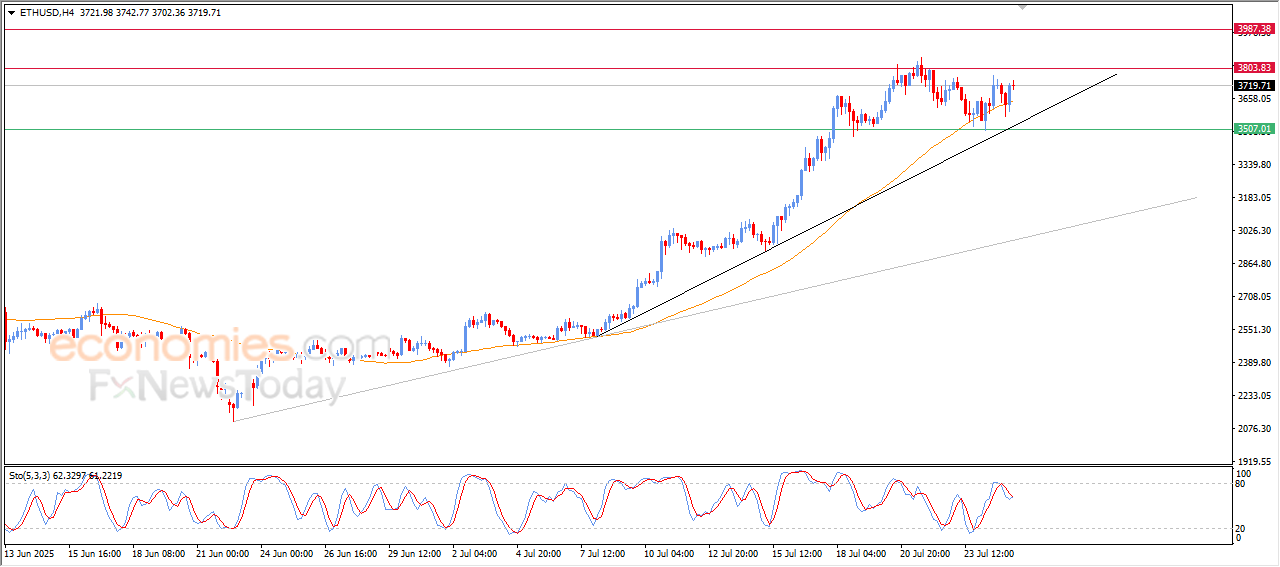
The price of (ETHUSD) rose in its recent intraday levels, due to its lean in its early trading on the support of its EMA50, providing positive momentum that assisted it to achieve this last gains, amid the dominance of the main bullish trend on the short-term basis, and its moves alongside a supportive minor bias for the track, preparing to attack the critical resistance at $3,800, on the other hand, we notice the appearance of the negative signals on the (RSI), after reaching overbought levels, which might decelerate the price improvement on the near-term basis.
BestTradingSignal.com – Professional Trading Signals
High-accuracy trading signals delivered directly to your Telegram. Subscribe to specialized packages tailored for the world’s most important markets – all powered by BestTradingSignal.com .
US Stock Signals from €44/month
Subscribe via TelegramCrypto Signals from €49/month
Subscribe via TelegramForex Signals from €49/month
Subscribe via TelegramVIP Signals (Gold, Oil, Forex, Bitcoin, Ethereum, Indices) from €179/month
Subscribe via TelegramThe longer the subscription, the greater the savings and the more value you get.
Weekly performance report available here: Trading Signal Results – Week of July 14–18, 2025
Forecast update for Bitcoin -25-07-2025
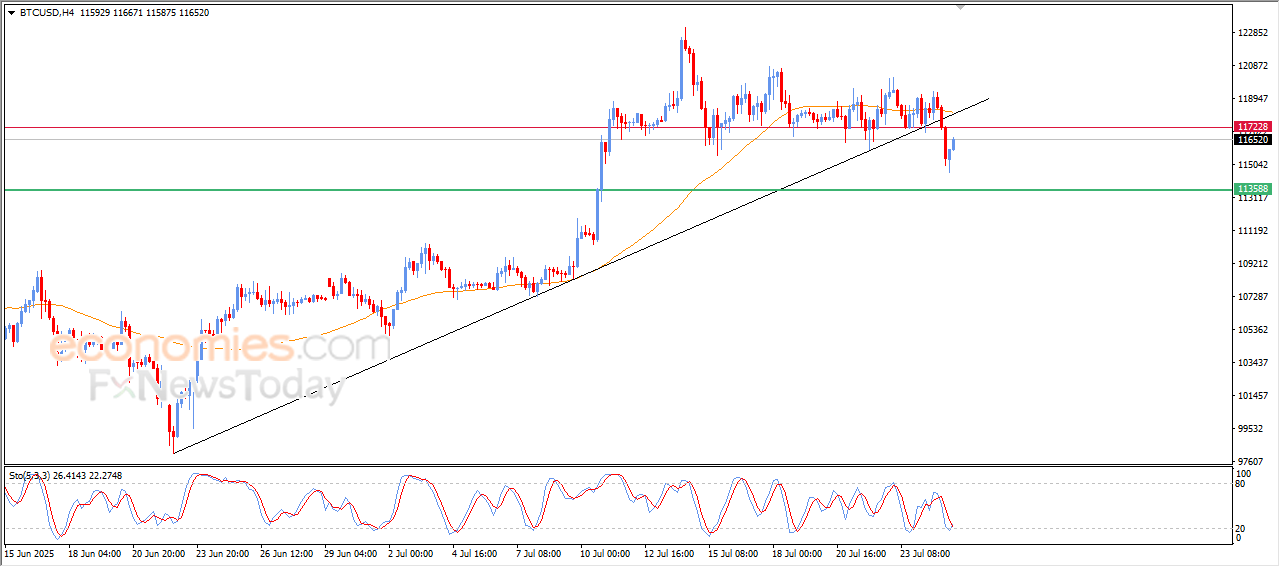
The price of (BTCUSD) rose in its last trading on the intraday levels, attempting to recover some of its early losses, and attempts at the same time to offload its clear oversold conditions on the (RSI), especially with the beginning of positive overlapping signals, despite this last rise the price confirmed breaking a main bullish trend line on the short-term basis, and there is an intensive negative pressure due to its trading below EMA50, indicating that the last bullish move is a temporary rebounding move.
BestTradingSignal.com – Professional Trading Signals
High-accuracy trading signals delivered directly to your Telegram. Subscribe to specialized packages tailored for the world’s most important markets – all powered by BestTradingSignal.com .
US Stock Signals from €44/month
Subscribe via TelegramCrypto Signals from €49/month
Subscribe via TelegramForex Signals from €49/month
Subscribe via TelegramVIP Signals (Gold, Oil, Forex, Bitcoin, Ethereum, Indices) from €179/month
Subscribe via TelegramThe longer the subscription, the greater the savings and the more value you get.
Weekly performance report available here: Trading Signal Results – Week of July 14–18, 2025
Forecast update for Brent crude oil -25-07-2025
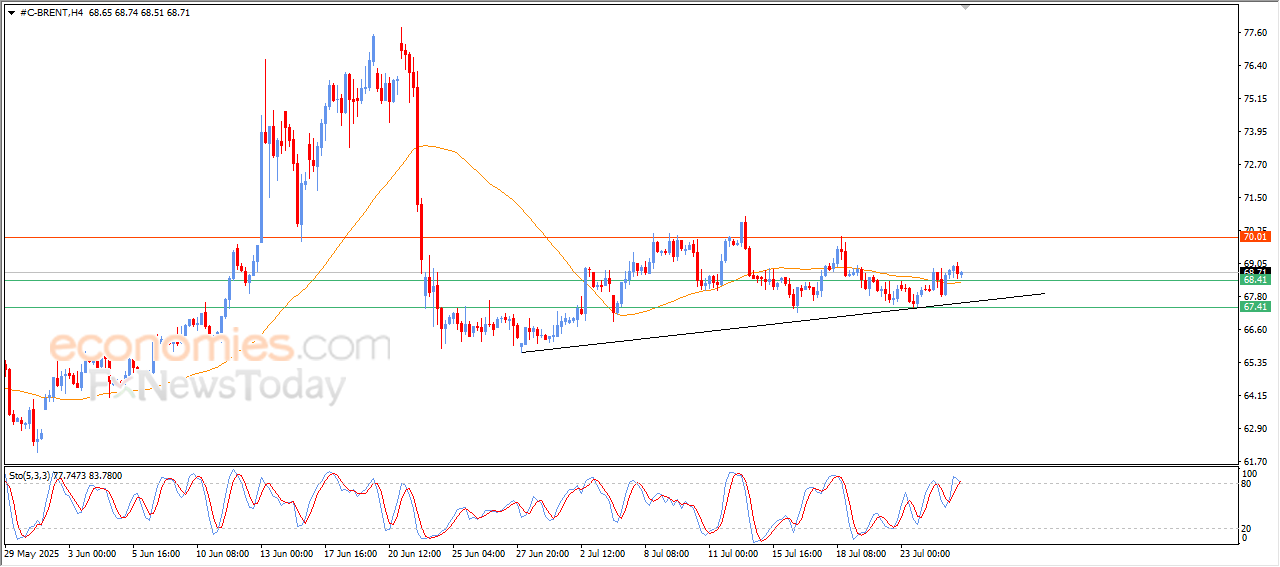
The price of (Brent) rose slightly in its last intraday levels, after getting support from its lean on the EMA50, forming dynamic pressure if the early decline of the price extended, attempted to offload some of its clear overbought conditions on the (RSI), amid its trading alongside a minor bullish trend line on a short-term basis.
BestTradingSignal.com – Professional Trading Signals
High-accuracy trading signals delivered directly to your Telegram. Subscribe to specialized packages tailored for the world’s most important markets – all powered by BestTradingSignal.com .
US Stock Signals from €44/month
Subscribe via TelegramCrypto Signals from €49/month
Subscribe via TelegramForex Signals from €49/month
Subscribe via TelegramVIP Signals (Gold, Oil, Forex, Bitcoin, Ethereum, Indices) from €179/month
Subscribe via TelegramThe longer the subscription, the greater the savings and the more value you get.
Weekly performance report available here: Trading Signal Results – Week of July 14–18, 2025