ASML price deepens losses - Forecast today - 23-07-2025
AI Summary
- ASML Holding N.V. (ASML) is experiencing a decline in recent trading, breaking below key support levels and showing potential for further losses
- Forecast for ASML stock is bearish, with a target support level at $666.60
- BestTradingSignal.com offers high-accuracy trading signals for various markets, with subscription packages available starting at €44/month
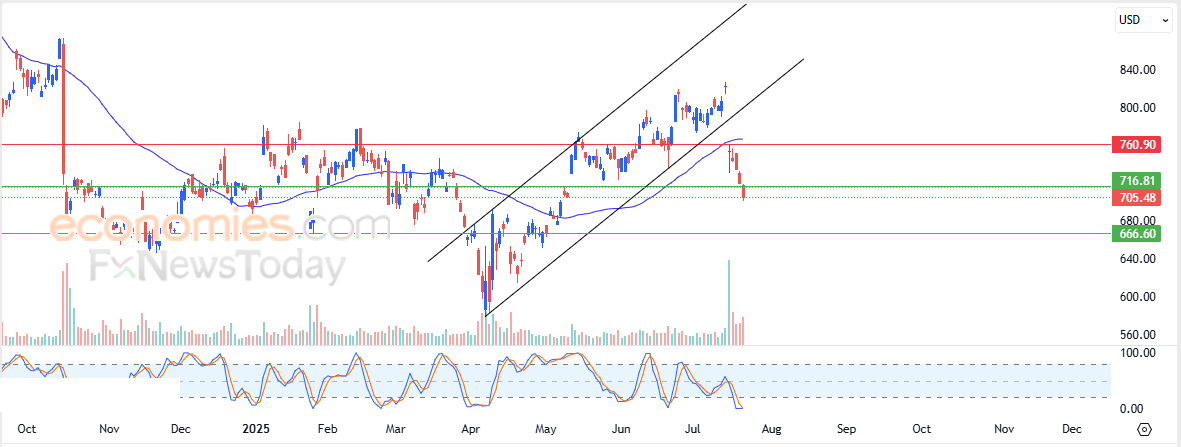
ASML Holding N.V. (ASML) continued its decline in recent intraday trading, pressured by sustained negative momentum from trading below the 50-day SMA. The stock was also impacted by an earlier breakdown from a short-term ascending price channel, which had previously guided its movement. This latest drop saw the stock break below the key support level at $716.80. However, a potential bullish crossover is beginning to appear in the Relative Strength Index after reaching deeply oversold territory, which may slightly limit further losses.
Therefore we expect the stock to continue declining in upcoming sessions, as long as it remains below $716.80, targeting the next support level at $666.60.
Today’s price forecast: Bearish.
BestTradingSignal.com – Professional Trading Signals
High-accuracy trading signals delivered directly to your Telegram. Subscribe to specialized packages tailored for the world’s most important markets – all powered by BestTradingSignal.com .
US Stock Signals from €44/month
Subscribe via TelegramCrypto Signals from €49/month
Subscribe via TelegramForex Signals from €49/month
Subscribe via TelegramVIP Signals (Gold, Oil, Forex, Bitcoin, Ethereum, Indices) from €179/month
Subscribe via TelegramThe longer the subscription, the greater the savings and the more value you get.
Weekly performance report available here: Trading Signal Results – Week of July 14–18, 2025
Gamestop price retests pivotal resistance - Forecast today - 23-07-2025
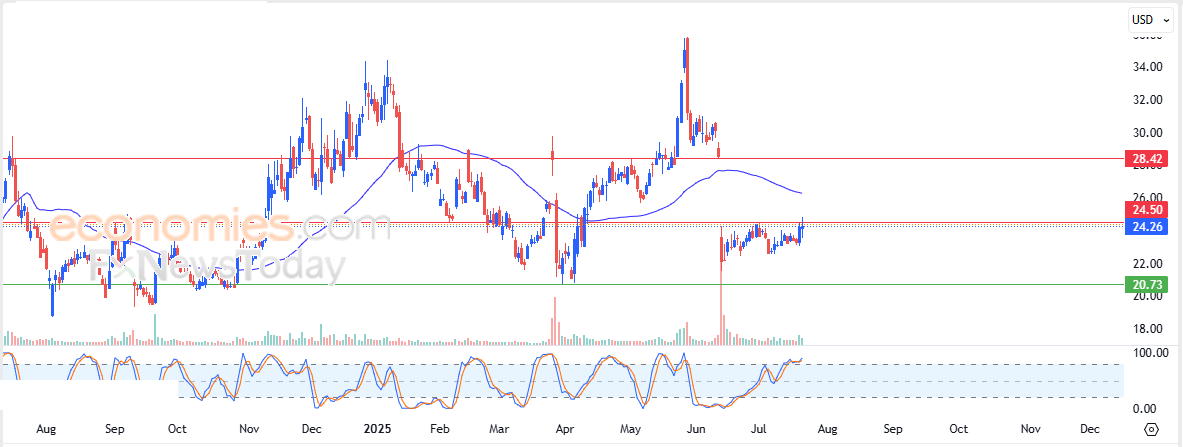
GameStop Corporation (GME) experienced a volatile session in recent intraday trading, following a retest of the key resistance level at $24.50, which held firm and triggered renewed downward pressure. The stock remains under the influence of a steep short-term corrective downtrend, with continued negative pressure from trading below the 50-day SMA. Additionally, the Relative Strength Index has reached extremely overbought territory relative to price action, suggesting the early formation of a bearish divergence.
High-Risk Warning: GME is part of the “meme stocks” group, which are often subject to heavy speculative trading. As a result, its price movements can frequently defy technical expectations or financial reports and may be highly unpredictable.
Therefore we expect the stock to decline in upcoming sessions, as long as the $24.50 resistance level holds, targeting the support level at $20.75.
Today’s price forecast: Bearish.
BestTradingSignal.com – Professional Trading Signals
High-accuracy trading signals delivered directly to your Telegram. Subscribe to specialized packages tailored for the world’s most important markets – all powered by BestTradingSignal.com .
US Stock Signals from €44/month
Subscribe via TelegramCrypto Signals from €49/month
Subscribe via TelegramForex Signals from €49/month
Subscribe via TelegramVIP Signals (Gold, Oil, Forex, Bitcoin, Ethereum, Indices) from €179/month
Subscribe via TelegramThe longer the subscription, the greater the savings and the more value you get.
Weekly performance report available here: Trading Signal Results – Week of July 14–18, 2025
Pinduoduo price extends gains - Forecast today - 23-07-2025
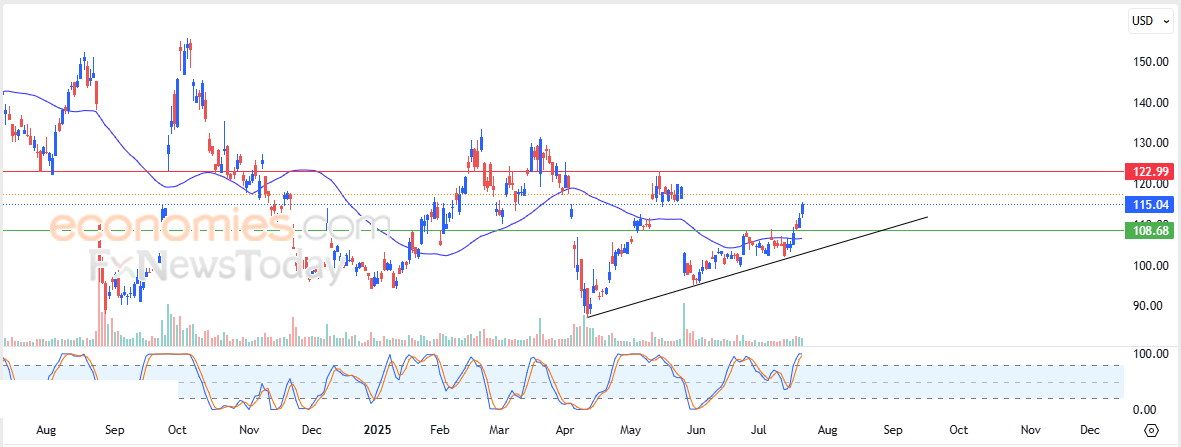
Pinduoduo Inc (PDD) extended its gains in recent intraday trading, supported by dynamic momentum from trading above its 50-day SMA. This helps stabilize the prevailing short-term corrective uptrend, as the stock continues to move along a supportive ascending trendline. Additionally, the Relative Strength Index is showing bullish signals, despite being in extremely overbought territory.
Therefore we expect the stock to rise in upcoming sessions, as long as support at $108.70 holds, targeting the key resistance level at $123.00.
Today’s price forecast: Bullish.
BestTradingSignal.com – Professional Trading Signals
High-accuracy trading signals delivered directly to your Telegram. Subscribe to specialized packages tailored for the world’s most important markets – all powered by BestTradingSignal.com .
US Stock Signals from €44/month
Subscribe via TelegramCrypto Signals from €49/month
Subscribe via TelegramForex Signals from €49/month
Subscribe via TelegramVIP Signals (Gold, Oil, Forex, Bitcoin, Ethereum, Indices) from €179/month
Subscribe via TelegramThe longer the subscription, the greater the savings and the more value you get.
Weekly performance report available here: Trading Signal Results – Week of July 14–18, 2025
IBM price seeks a supportive bottom - Forecast today - 23-07-2025
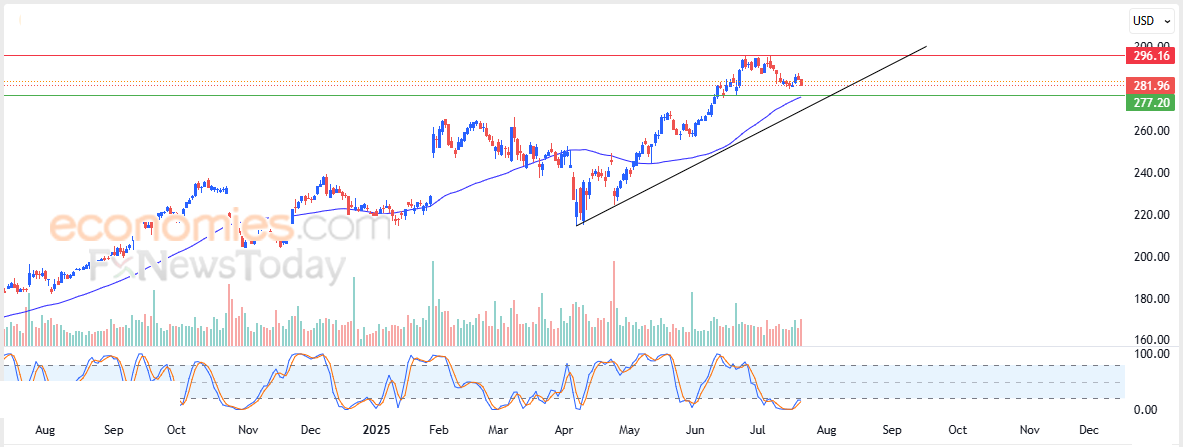
International Business Machines Corporation (IBM) declined in its latest intraday trading, as it attempts to establish a higher low that could serve as a base for regaining positive momentum and resuming its recovery. The stock remains supported by dynamic backing from trading above its 50-day SMA, and it continues to move within a dominant upward trend along a short-term ascending trendline. Additionally, a bullish divergence is beginning to form in the Relative Strength Index, after it reached extremely oversold territory relative to price action, with early bullish signals starting to appear.
Therefore we expect the stock to rise in upcoming sessions, provided support at $277.20 holds, targeting the key resistance level at $296.00.
Today’s price forecast: Bullish.
BestTradingSignal.com – Professional Trading Signals
High-accuracy trading signals delivered directly to your Telegram. Subscribe to specialized packages tailored for the world’s most important markets – all powered by BestTradingSignal.com .
US Stock Signals from €44/month
Subscribe via TelegramCrypto Signals from €49/month
Subscribe via TelegramForex Signals from €49/month
Subscribe via TelegramVIP Signals (Gold, Oil, Forex, Bitcoin, Ethereum, Indices) from €179/month
Subscribe via TelegramThe longer the subscription, the greater the savings and the more value you get.
Weekly performance report available here: Trading Signal Results – Week of July 14–18, 2025