Eli Lilly price leans on SMA support - Forecast today - 11-05-2026
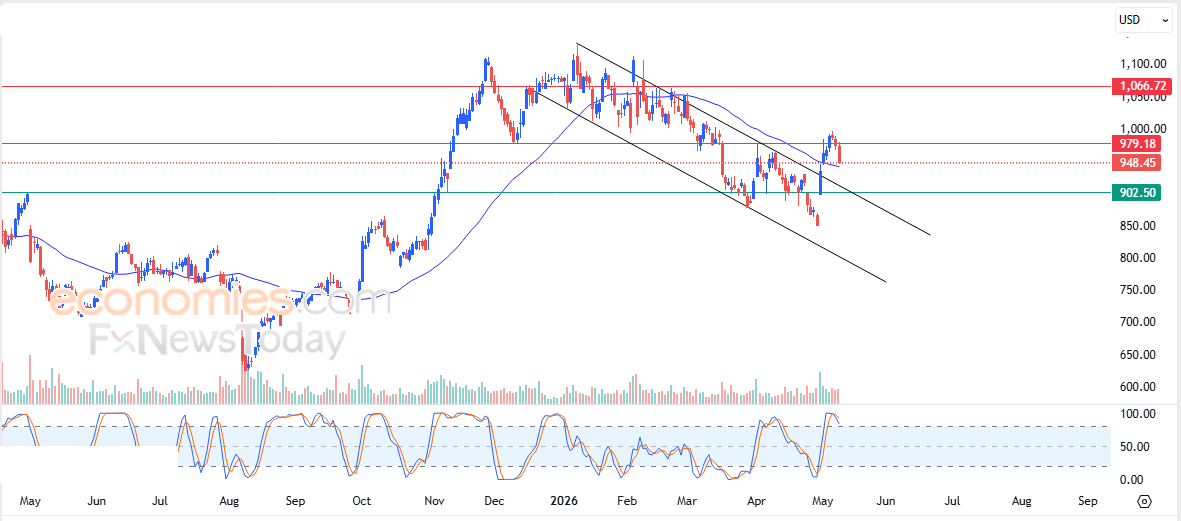
Eli Lilly and Company (LLY) stock price declined in its latest intraday trading after the current resistance level at $979.00 held firm, as the stock takes profits from its previous gains and attempts to relieve part of its clear overbought condition on the Stochastic indicators, especially with the beginning of negative signals emerging from them, in an effort to regain positive momentum that could help it recover and break above this resistance, while finding support from its 50-day SMA, amid the stock’s earlier breakout from a short-term corrective bearish price channel.
Therefore we expect the stock price to rise in its upcoming trading, especially if it succeeds in breaking above the mentioned resistance at $979.00, targeting the psychological resistance level at $1,000.
Today’s price forecast: Bullish
Walmart price readies to tackle pivotal resistance - Forecast today - 11-05-2026
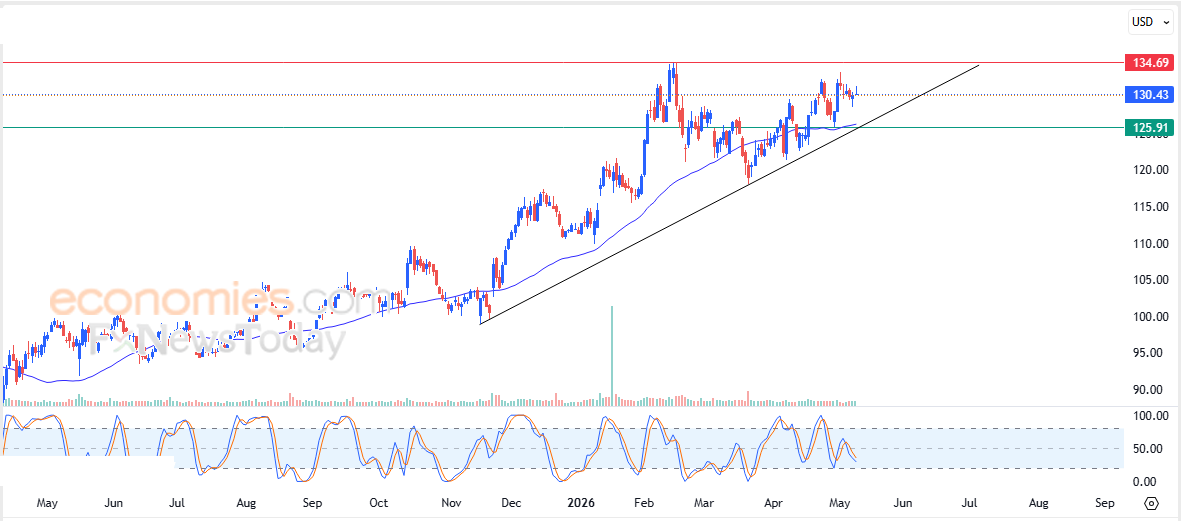
Walmart Inc. (WMT) stock price rose in its latest intraday trading amid continued dynamic positive support from trading above its 50-day SMA, which reinforces the stability and dominance of the main upward trend in the short term, while moving alongside a trend line supporting this path, although we notice continued negative signals from the Stochastic indicators, which may limit the stock’s upcoming gains.
Therefore we expect the stock price to rise in its upcoming trading, as long as it holds above the $125.90 support level, targeting the nearby key resistance level at $134.70 in preparation for attacking it.
Today’s price forecast: Bullish
Forecast update for Ethereum -11-05-2026
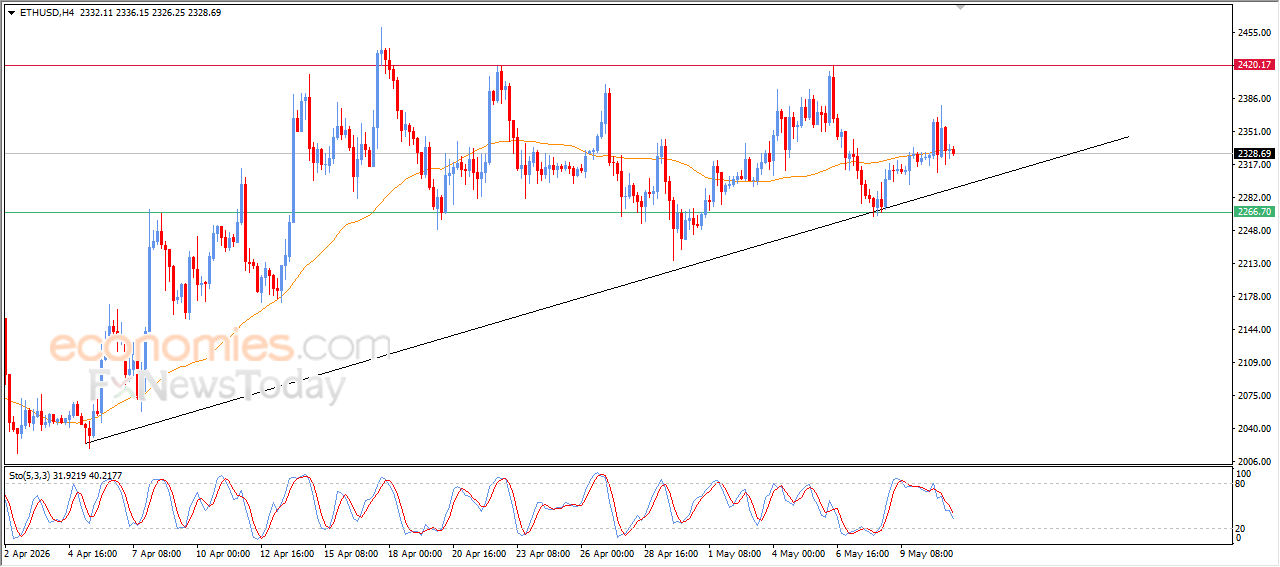
Ethereum price (ETHUSD) declined during its recent intraday trading, amid the emergence of the negative signals of the relative strength indicators, after reaching overbought levels previously, attempting to gain bullish momentum that might help it to recover and rise again, leaning on EMA50’s support, as a strong signals for a potential recovery, especially with the dominance of the main bullish trend on the short-term basis, with its trading alongside supportive trend line for this path.
Forecast update for Brent -11-05-2026
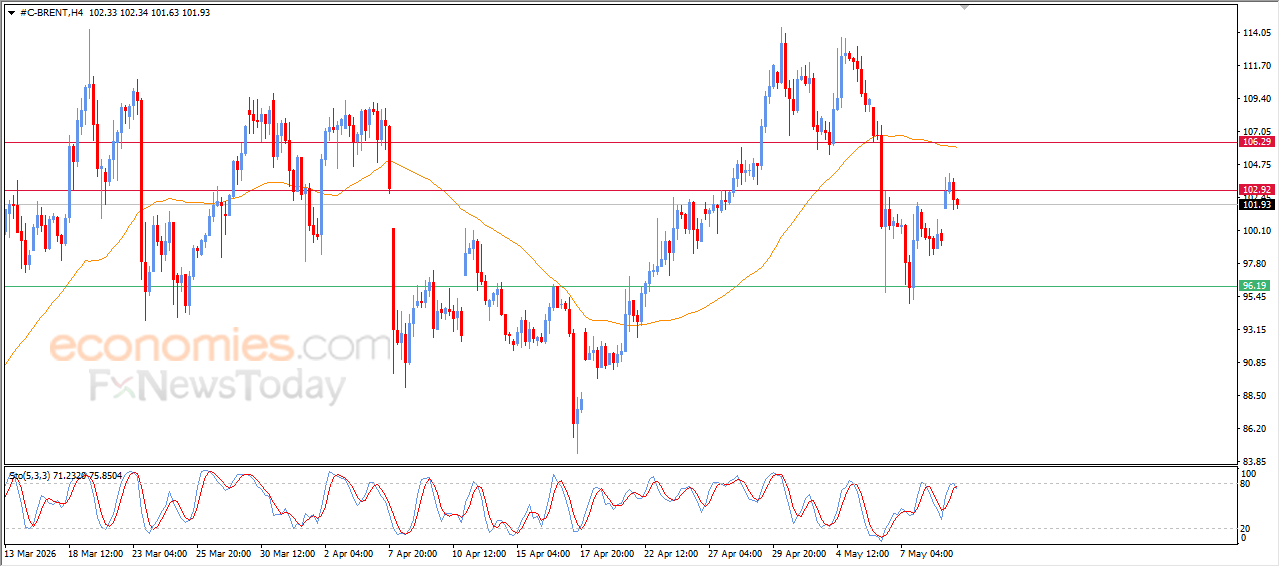
Brent crude oil price declined during its recent intraday trading, amid the dominance of bearish corrective wave on the short-term basis, with the continuation of the negative and dynamic pressure that is represented by its trading below EMA50, intensifying the negative pressure on the price, especially with the emergence of negative overlapping signals from the relative strength indicators, after reaching overbought levels, which reduces the chances of sustainable recovery.