ExxonMobil price tries to recoup some losses - Forecast today - 12-05-2025
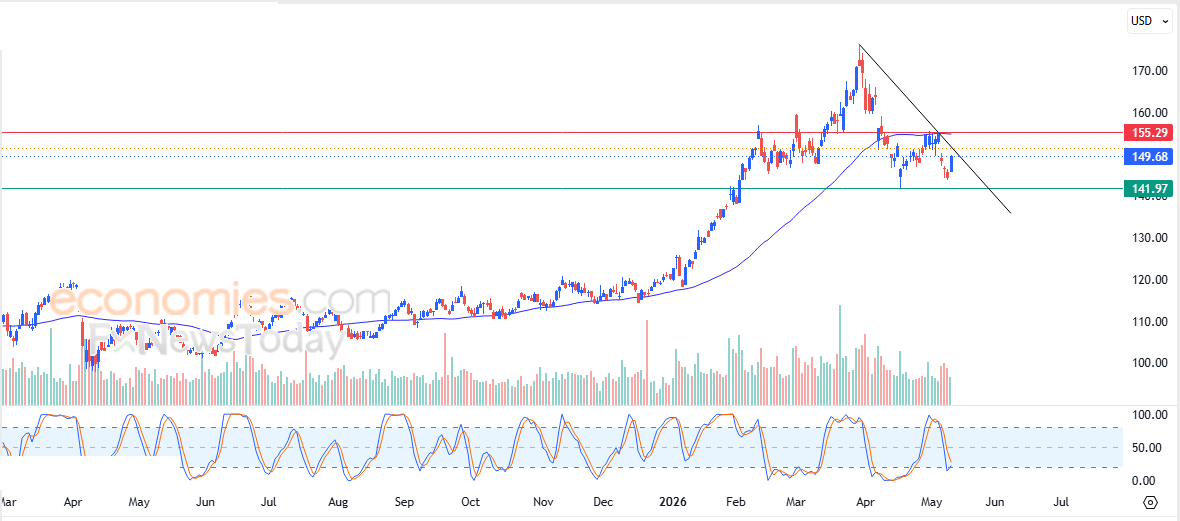
Exxon Mobil Corporation (XOM) stock price rose in its latest intraday trading, as the stock attempts to recover part of its previous losses, amid the dominance of a short-term corrective bearish wave while moving alongside a trend line supporting this path, in addition to continued negative pressure from trading below its 50-day SMA, while in the background we notice continued negative signals from the Stochastic indicators.
Therefore we expect the stock price to decline in its upcoming trading, as long as it remains below the $155.30 resistance level, targeting the key support level at $142.00.
Today’s price forecast: Neutral
Forecast update for Ethereum -12-05-2026
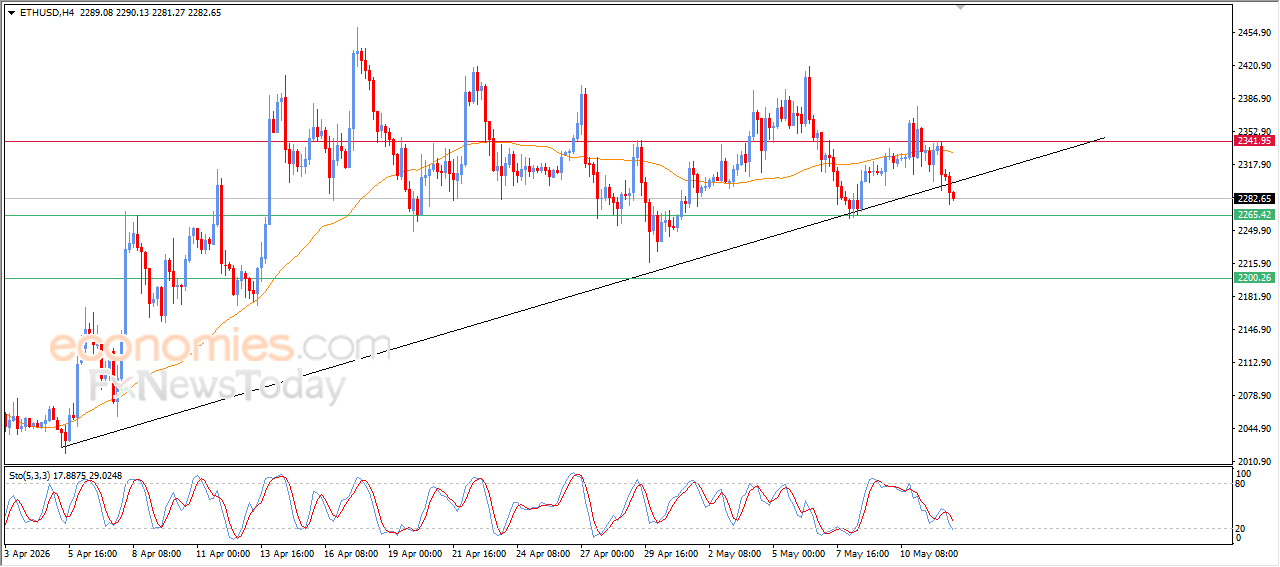
Ethereum price (ETHUSD) continued to decline during its recent intraday trading, under pressure from negative signals generated by trading below EMA50, along with bearish signals from the relative strength indicators. The price also broke a short-term upward trendline, which ends the near-term recovery attempts, especially if the decline continues and nearby support levels are broken.
Forecast update for Brent -12-05-2026
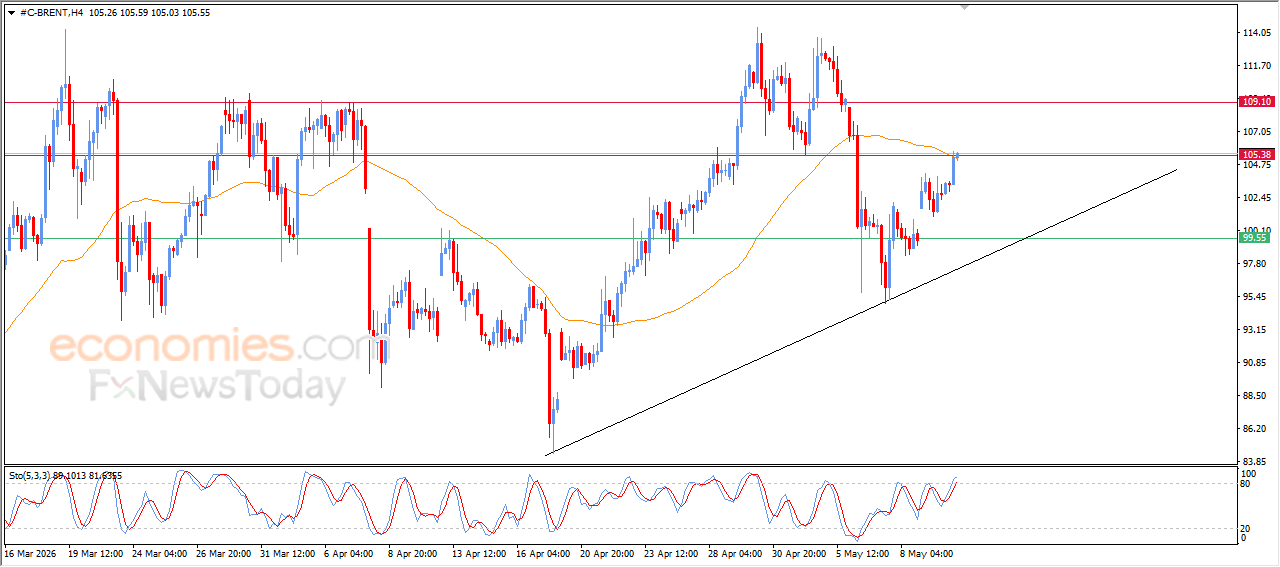
Brent crude oil prices recorded strong gains during recent intraday trading, reaching the key resistance level at $105.00, accompanied by reaching the EMA50 resistance, increasing the importance of this area as a pivotal resistance zone that could determine the next short-term direction of the price. This comes while the main bullish trend continues to dominate in the short term, with prices moving alongside a supportive upward trendline, in addition to positive signals emerging from the relative strength indicators.
Forecast update for Bitcoin -12-05-2026
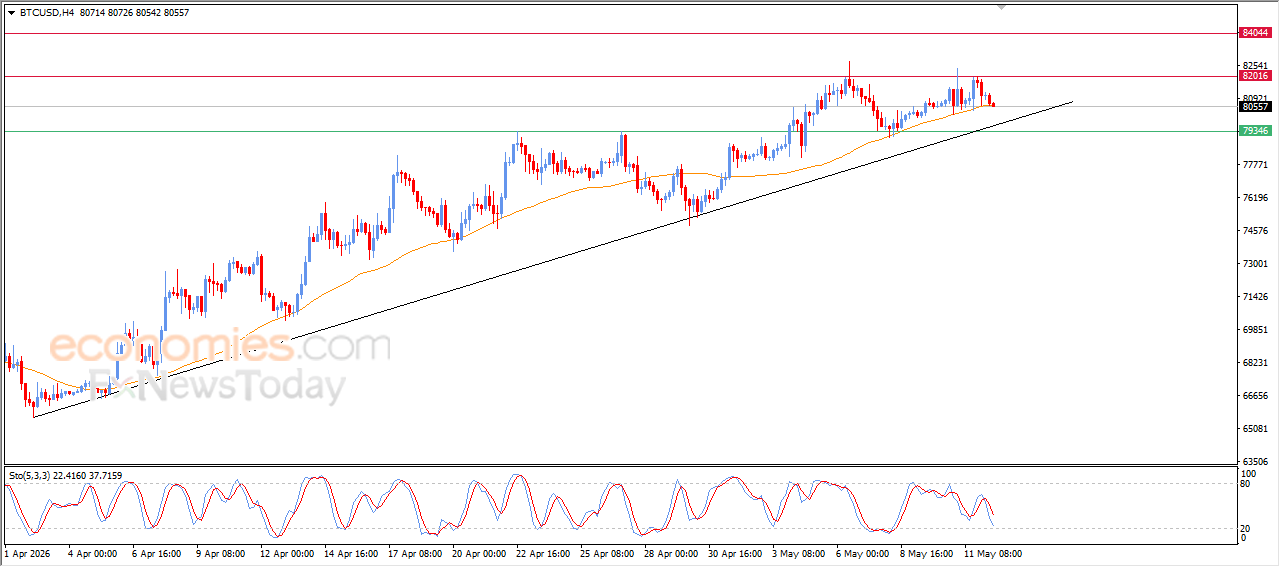
Bitcoin (BTCUSD) declined in its latest intraday trading, amid the emergence of the negative signals from the relative strength indicators, to lean on EMA50’s support, as a last attempt to find higher low to use it as a base to help it to gain the required bullish momentum for its recovery, amid the dominance of the main bullish trend on short-term basis, with its trading alongside supportive trend line for this path.